
Los Angeles Angels at Oakland Athletics
· Major League Baseball
Los Angeles Angels
9-19, 4-10 Away
<span class="badge bg-danger" style="font-size: 1.2em; margin: 5px 0;">Final</span>
4 - 3
4 - 3

Oakland Athletics
19-9, 12-4 HomeTrout drives in 3 runs, makes diving catch as Angels top A's
How can I watch Los Angeles Angels vs. Oakland Athletics?
- TV Channel: Angels at Athletics 2022 MLB Baseball, is broadcasted on MLB.tv.
- Online streaming: Sign up for Fubo.
Scoring Summary
 |
9th Inning | Kemp flied out to left. |
|
9th Inning | Piscotty lined out to left. |
|
9th Inning | Grossman fouled out to third. |
 |
9th Inning | Rendon grounded into fielder's choice to second, La Stella out at second. |
|
9th Inning | Trout fouled out to first. |
|
9th Inning | La Stella grounded into fielder's choice to shortstop, Fletcher out at second. |
Statistics
 LAA LAA |
 OAK OAK |
|
|---|---|---|
| 1 | Games Played | 1 |
| 1 | Team Games Played | 1 |
| 0 | Hit By Pitch | 0 |
| 15 | Ground Balls | 5 |
| 6 | Strikeouts | 5 |
| 4 | Runs Batted In | 3 |
| 1 | Sacrifice Hit | 0 |
| 8 | Hits | 6 |
| 0 | Stolen Bases | 1 |
| 3 | Walks | 3 |
| 0 | Catcher Interference | 0 |
| 4 | Runs | 3 |
| 0 | Ground Into Double Play | 0 |
| 0 | Sacrifice Flies | 0 |
| 36 | At Bats | 32 |
| 0 | Home Runs | 1 |
| 0 | Grand Slam Home Runs | 0 |
| 21 | Runners Left On Base | 11 |
| 0 | Triples | 0 |
| 1 | Game Winning RBIs | 0 |
| 0 | Intentional Walks | 0 |
| 3 | Doubles | 3 |
| 16 | Fly Balls | 22 |
| 1 | Caught Stealing | 0 |
| 151 | Pitches | 132 |
| 0 | Games Started | 0 |
| 0 | Pinch At Bats | 0 |
| 0 | Pinch Hits | 0 |
| 0.0 | Player Rating | 0.0 |
| 1 | Is Qualified | 1 |
| 1 | Is Qualified In Steals | 1 |
| 11 | Total Bases | 12 |
| 40 | Plate Appearances | 35 |
| 0.0 | Projected Home Runs | 162.0 |
| 3 | Extra Base Hits | 4 |
| 2.9 | Runs Created | 3.4 |
| .222 | Batting Average | .188 |
| .000 | Pinch Hit Average | .000 |
| .306 | Slugging Percentage | .375 |
| .139 | Secondary Average | .313 |
| .282 | On Base Percentage | .257 |
| .588 | OBP Pct + SLG Pct | .632 |
| 0.9 | Ground To Fly Ball Ratio | 0.2 |
| 2.6 | Runs Created Per 27 Outs | 3.5 |
| 30.0 | Batter Rating | 28.0 |
| 0.0 | At Bats Per Home Run | 32.0 |
| 0.00 | Stolen Base Percentage | 1.00 |
| 3.78 | Pitches Per Plate Appearance | 3.77 |
| .083 | Isolated Power | .188 |
| 0.50 | Walk To Strikeout Ratio | 0.60 |
| .075 | Walks Per Plate Appearance | .086 |
| -.083 | Secondary Average Minus Batting Average | .125 |
| 8.0 | Runs Produced | 6.0 |
| 1.0 | Runs Ratio | 1.0 |
| 0.4 | Patience Ratio | 0.4 |
| 0.3 | Balls In Play Average | 0.2 |
| 78.3 | MLB Rating | 76.3 |
| 0.0 | Offensive Wins Above Replacement | 0.0 |
| 0.0 | Wins Above Replacement | 0.0 |
Game Information
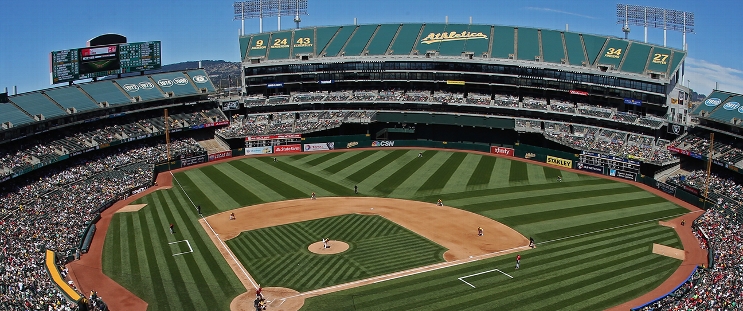
Oakland Coliseum
Location: Oakland, California
Capacity:
2026 American League West Standings
| TEAM | W | L | PCT | GB | STRK |
|---|---|---|---|---|---|
| <img src="https://a.espncdn.com/i/teamlogos/mlb/500/ath.png" class="logo-micro">Athletics | 27 | 26 | .509 | - | W1 |
| <img src="https://a.espncdn.com/i/teamlogos/mlb/500/sea.png" class="logo-micro">Seattle | 25 | 29 | .463 | 2.5 | L2 |
| <img src="https://a.espncdn.com/i/teamlogos/mlb/500/tex.png" class="logo-micro">Texas | 24 | 28 | .462 | 2.5 | L3 |
| <img src="https://a.espncdn.com/i/teamlogos/mlb/500/hou.png" class="logo-micro">Houston | 23 | 31 | .426 | 4.5 | W3 |
| <img src="https://a.espncdn.com/i/teamlogos/mlb/500/laa.png" class="logo-micro">Los Angeles | 20 | 34 | .370 | 7.5 | W3 |