
San Diego Padres at Oakland Athletics
· Major League Baseball
San Diego Padres
24-16, 12-10 Away
<span class="badge bg-danger" style="font-size: 1.2em; margin: 5px 0;">Final</span>
7 - 0
7 - 0

Oakland Athletics
22-13, 13-5 HomeFernando Tatís Jr. and slugging Padres pound Athletics 7-0
How can I watch San Diego Padres vs. Oakland Athletics?
- TV Channel: Padres at Athletics 2022 MLB Baseball, is broadcasted on MLB.tv.
- Online streaming: Sign up for Fubo.
Scoring Summary
 |
9th Inning | Grossman flied out to center. |
|
9th Inning | Olson grounded out to third. |
|
9th Inning | Canha flied out to center. |
 |
9th Inning | Stammen relieved Guerra |
|
9th Inning | Garcia at third base. |
|
9th Inning | Myers flied out to center. |
Statistics
 SD SD |
 OAK OAK |
|
|---|---|---|
| 1 | Games Played | 1 |
| 1 | Team Games Played | 1 |
| 1 | Hit By Pitch | 0 |
| 20 | Ground Balls | 9 |
| 8 | Strikeouts | 5 |
| 7 | Runs Batted In | 0 |
| 0 | Sacrifice Hit | 0 |
| 11 | Hits | 4 |
| 0 | Stolen Bases | 0 |
| 0 | Walks | 4 |
| 0 | Catcher Interference | 0 |
| 7 | Runs | 0 |
| 0 | Ground Into Double Play | 1 |
| 0 | Sacrifice Flies | 0 |
| 40 | At Bats | 29 |
| 3 | Home Runs | 0 |
| 0 | Grand Slam Home Runs | 0 |
| 15 | Runners Left On Base | 11 |
| 0 | Triples | 0 |
| 1 | Game Winning RBIs | 0 |
| 0 | Intentional Walks | 0 |
| 3 | Doubles | 1 |
| 12 | Fly Balls | 15 |
| 0 | Caught Stealing | 0 |
| 159 | Pitches | 121 |
| 0 | Games Started | 0 |
| 0 | Pinch At Bats | 0 |
| 0 | Pinch Hits | 0 |
| 0.0 | Player Rating | 0.0 |
| 1 | Is Qualified | 1 |
| 0 | Is Qualified In Steals | 0 |
| 23 | Total Bases | 5 |
| 41 | Plate Appearances | 33 |
| 486.0 | Projected Home Runs | 0.0 |
| 6 | Extra Base Hits | 1 |
| 6.8 | Runs Created | 0.7 |
| .275 | Batting Average | .138 |
| .000 | Pinch Hit Average | .000 |
| .575 | Slugging Percentage | .172 |
| .300 | Secondary Average | .172 |
| .293 | On Base Percentage | .242 |
| .868 | OBP Pct + SLG Pct | .415 |
| 1.7 | Ground To Fly Ball Ratio | 0.6 |
| 6.3 | Runs Created Per 27 Outs | 0.8 |
| 54.0 | Batter Rating | 6.0 |
| 13.3 | At Bats Per Home Run | 0.0 |
| 0.00 | Stolen Base Percentage | 0.00 |
| 3.88 | Pitches Per Plate Appearance | 3.67 |
| .300 | Isolated Power | .034 |
| 0.00 | Walk To Strikeout Ratio | 0.80 |
| .000 | Walks Per Plate Appearance | .121 |
| .025 | Secondary Average Minus Batting Average | .034 |
| 14.0 | Runs Produced | 0.0 |
| 1.0 | Runs Ratio | 0.0 |
| 0.6 | Patience Ratio | 0.3 |
| 0.3 | Balls In Play Average | 0.2 |
| 98.0 | MLB Rating | 61.5 |
| 0.0 | Offensive Wins Above Replacement | 0.0 |
| 0.0 | Wins Above Replacement | 0.0 |
Game Information
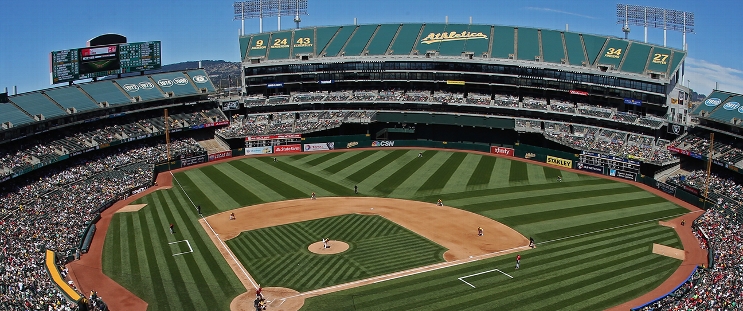
Oakland Coliseum
Location: Oakland, California
Capacity:
2026 National League West Standings
| TEAM | W | L | PCT | GB | STRK |
|---|---|---|---|---|---|
| <img src="https://a.espncdn.com/i/teamlogos/mlb/500/lad.png" class="logo-micro">Los Angeles | 32 | 20 | .615 | - | W1 |
| <img src="https://a.espncdn.com/i/teamlogos/mlb/500/sd.png" class="logo-micro">San Diego | 31 | 20 | .608 | 0.5 | W2 |
| <img src="https://a.espncdn.com/i/teamlogos/mlb/500/ari.png" class="logo-micro">Arizona | 27 | 24 | .529 | 4.5 | W1 |
| <img src="https://a.espncdn.com/i/teamlogos/mlb/500/sf.png" class="logo-micro">San Francisco | 21 | 31 | .404 | 11 | W1 |
| <img src="https://a.espncdn.com/i/teamlogos/mlb/500/col.png" class="logo-micro">Colorado | 20 | 33 | .377 | 12.5 | L1 |