
San Francisco Giants at Oakland Athletics
· Major League Baseball
San Francisco Giants
26-26, 10-17 Away
<span class="badge bg-danger" style="font-size: 1.2em; margin: 5px 0;">Final</span>
14 - 2
14 - 2

Oakland Athletics
33-20, 20-8 HomeAfter a pair of shutouts, Giants respond to rout A's 14-2
How can I watch San Francisco Giants vs. Oakland Athletics?
- TV Channel: Giants at Athletics 2022 MLB Baseball, is broadcasted on ESPN.
- Online streaming: Sign up for Fubo.
Scoring Summary
 |
9th Inning | Machín grounded out to pitcher. |
|
9th Inning | Murphy singled to left, Laureano to second. |
|
9th Inning | Laureano hit by pitch. |
|
9th Inning | Lamb lined out to center. |
|
9th Inning | Davis flied out to right. |
 |
9th Inning | Peralta relieved Baragar |
Statistics
 SF SF |
 OAK OAK |
|
|---|---|---|
| 1 | Games Played | 1 |
| 1 | Team Games Played | 1 |
| 0 | Hit By Pitch | 2 |
| 5 | Ground Balls | 10 |
| 14 | Strikeouts | 5 |
| 14 | Runs Batted In | 2 |
| 0 | Sacrifice Hit | 0 |
| 15 | Hits | 5 |
| 1 | Stolen Bases | 0 |
| 8 | Walks | 3 |
| 0 | Catcher Interference | 0 |
| 14 | Runs | 2 |
| 0 | Ground Into Double Play | 1 |
| 0 | Sacrifice Flies | 0 |
| 41 | At Bats | 32 |
| 3 | Home Runs | 0 |
| 1 | Grand Slam Home Runs | 0 |
| 17 | Runners Left On Base | 17 |
| 0 | Triples | 0 |
| 1 | Game Winning RBIs | 0 |
| 0 | Intentional Walks | 0 |
| 1 | Doubles | 0 |
| 22 | Fly Balls | 17 |
| 0 | Caught Stealing | 0 |
| 193 | Pitches | 142 |
| 0 | Games Started | 0 |
| 0 | Pinch At Bats | 1 |
| 0 | Pinch Hits | 0 |
| 0.0 | Player Rating | 0.0 |
| 1 | Is Qualified | 1 |
| 1 | Is Qualified In Steals | 0 |
| 25 | Total Bases | 5 |
| 49 | Plate Appearances | 37 |
| 486.0 | Projected Home Runs | 0.0 |
| 4 | Extra Base Hits | 0 |
| 11.5 | Runs Created | 1.1 |
| .366 | Batting Average | .156 |
| .000 | Pinch Hit Average | .000 |
| .610 | Slugging Percentage | .156 |
| .463 | Secondary Average | .094 |
| .469 | On Base Percentage | .270 |
| 1.079 | OBP Pct + SLG Pct | .427 |
| 0.2 | Ground To Fly Ball Ratio | 0.6 |
| 11.9 | Runs Created Per 27 Outs | 1.1 |
| 83.0 | Batter Rating | 13.0 |
| 13.7 | At Bats Per Home Run | 0.0 |
| 1.00 | Stolen Base Percentage | 0.00 |
| 3.94 | Pitches Per Plate Appearance | 3.84 |
| .244 | Isolated Power | .000 |
| 0.57 | Walk To Strikeout Ratio | 0.60 |
| .163 | Walks Per Plate Appearance | .081 |
| .098 | Secondary Average Minus Batting Average | -.063 |
| 28.0 | Runs Produced | 4.0 |
| 1.0 | Runs Ratio | 1.0 |
| 0.7 | Patience Ratio | 0.3 |
| 0.5 | Balls In Play Average | 0.2 |
| 119.3 | MLB Rating | 66.3 |
| 0.0 | Offensive Wins Above Replacement | 0.0 |
| 0.0 | Wins Above Replacement | 0.0 |
Game Information
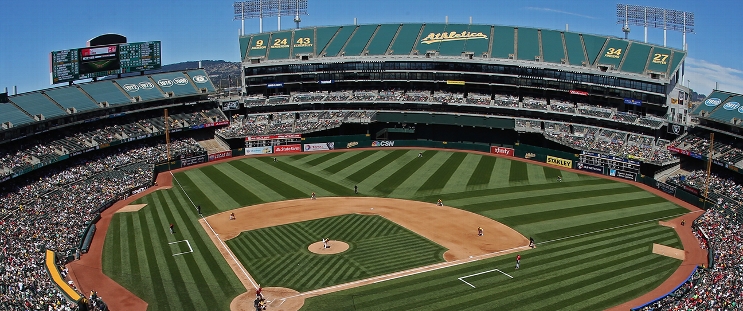
Oakland Coliseum
Location: Oakland, California
Capacity:
2026 National League West Standings
| TEAM | W | L | PCT | GB | STRK |
|---|---|---|---|---|---|
| <img src="https://a.espncdn.com/i/teamlogos/mlb/500/lad.png" class="logo-micro">Los Angeles | 31 | 20 | .608 | - | L1 |
| <img src="https://a.espncdn.com/i/teamlogos/mlb/500/sd.png" class="logo-micro">San Diego | 30 | 20 | .600 | 0.5 | W1 |
| <img src="https://a.espncdn.com/i/teamlogos/mlb/500/ari.png" class="logo-micro">Arizona | 26 | 24 | .520 | 4.5 | L1 |
| <img src="https://a.espncdn.com/i/teamlogos/mlb/500/sf.png" class="logo-micro">San Francisco | 21 | 31 | .404 | 10.5 | W1 |
| <img src="https://a.espncdn.com/i/teamlogos/mlb/500/col.png" class="logo-micro">Colorado | 20 | 32 | .385 | 11.5 | W1 |