
Seattle Mariners at Milwaukee Brewers
· Major League Baseball
Seattle Mariners
8-8-5, 3-4-3 Away
<span class="badge bg-danger" style="font-size: 1.2em; margin: 5px 0;">Final</span>
3 - 1
3 - 1

Milwaukee Brewers
10-9-1, 3-6-1 HomeHow To Watch
How can I watch Seattle Mariners vs. Milwaukee Brewers?
- TV Channel: Mariners at Brewers 2022 MLB Baseball, is broadcasted on MLB.tv.
- Online streaming: Sign up for Fubo.
Scoring Summary
 |
9th Inning | Feliciano struck out looking. |
|
9th Inning | Perez grounded into double play, second to shortstop to first, Westbrook out at second. |
|
9th Inning | Westbrook singled to center. |
 |
9th Inning | Newsome relieved Fletcher |
|
9th Inning | Walton grounded out to third. |
|
9th Inning | Liberato struck out swinging. |
Statistics
 SEA SEA |
 MIL MIL |
|
|---|---|---|
| 1 | Games Played | 1 |
| 1 | Team Games Played | 1 |
| 1 | Hit By Pitch | 0 |
| 0 | Ground Balls | 0 |
| 11 | Strikeouts | 14 |
| 3 | Runs Batted In | 1 |
| 0 | Sacrifice Hit | 0 |
| 9 | Hits | 5 |
| 2 | Stolen Bases | 1 |
| 1 | Walks | 3 |
| 0 | Catcher Interference | 0 |
| 3 | Runs | 1 |
| 1 | Ground Into Double Play | 1 |
| 0 | Sacrifice Flies | 0 |
| 34 | At Bats | 30 |
| 3 | Home Runs | 0 |
| 0 | Grand Slam Home Runs | 0 |
| 15 | Runners Left On Base | 11 |
| 0 | Triples | 0 |
| 0 | Game Winning RBIs | 0 |
| 0 | Intentional Walks | 0 |
| 3 | Doubles | 1 |
| 0 | Fly Balls | 0 |
| 1 | Caught Stealing | 0 |
| 0 | Pitches | 0 |
| 0 | Games Started | 0 |
| 0 | Pinch At Bats | 0 |
| 0 | Pinch Hits | 0 |
| 0.0 | Player Rating | 0.0 |
| 1 | Is Qualified | 1 |
| 1 | Is Qualified In Steals | 1 |
| 21 | Total Bases | 6 |
| 36 | Plate Appearances | 33 |
| 486.0 | Projected Home Runs | 0.0 |
| 6 | Extra Base Hits | 1 |
| 6.0 | Runs Created | 1.1 |
| .265 | Batting Average | .167 |
| .000 | Pinch Hit Average | .000 |
| .618 | Slugging Percentage | .200 |
| .412 | Secondary Average | .167 |
| .306 | On Base Percentage | .242 |
| .923 | OBP Pct + SLG Pct | .442 |
| 0.0 | Ground To Fly Ball Ratio | 0.0 |
| 6.0 | Runs Created Per 27 Outs | 1.1 |
| 38.0 | Batter Rating | 12.0 |
| 11.3 | At Bats Per Home Run | 0.0 |
| 0.67 | Stolen Base Percentage | 1.00 |
| 0.00 | Pitches Per Plate Appearance | 0.00 |
| .353 | Isolated Power | .033 |
| 0.09 | Walk To Strikeout Ratio | 0.21 |
| .028 | Walks Per Plate Appearance | .091 |
| .147 | Secondary Average Minus Batting Average | .000 |
| 6.0 | Runs Produced | 2.0 |
| 1.0 | Runs Ratio | 1.0 |
| 0.7 | Patience Ratio | 0.3 |
| 0.3 | Balls In Play Average | 0.3 |
| 86.8 | MLB Rating | 63.3 |
| 0.0 | Offensive Wins Above Replacement | 0.0 |
| 0.0 | Wins Above Replacement | 0.0 |
Game Information
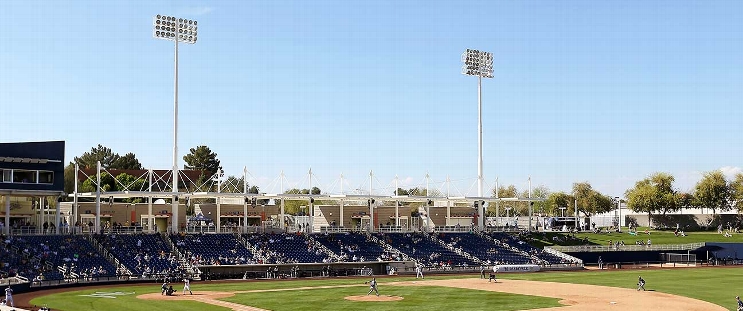
American Family Fields of Phoenix
Location: Phoenix, Arizona
Attendance: 2,242 | Capacity:
2026 American League West Standings
| TEAM | W | L | PCT | GB | STRK |
|---|---|---|---|---|---|
| <img src="https://a.espncdn.com/i/teamlogos/mlb/500/ath.png" class="logo-micro">Athletics | 22 | 20 | .524 | - | W1 |
| <img src="https://a.espncdn.com/i/teamlogos/mlb/500/tex.png" class="logo-micro">Texas | 21 | 22 | .488 | 1.5 | W2 |
| <img src="https://a.espncdn.com/i/teamlogos/mlb/500/sea.png" class="logo-micro">Seattle | 21 | 23 | .477 | 2 | L1 |
| <img src="https://a.espncdn.com/i/teamlogos/mlb/500/hou.png" class="logo-micro">Houston | 17 | 27 | .386 | 6 | W1 |
| <img src="https://a.espncdn.com/i/teamlogos/mlb/500/laa.png" class="logo-micro">Los Angeles | 16 | 28 | .364 | 7 | L3 |
2026 National League Central Standings
| TEAM | W | L | PCT | GB | STRK |
|---|---|---|---|---|---|
| <img src="https://a.espncdn.com/i/teamlogos/mlb/500/chc.png" class="logo-micro">Chicago | 27 | 16 | .628 | - | L4 |
| <img src="https://a.espncdn.com/i/teamlogos/mlb/500/mil.png" class="logo-micro">Milwaukee | 23 | 17 | .575 | 2.5 | L1 |
| <img src="https://a.espncdn.com/i/teamlogos/mlb/500/stl.png" class="logo-micro">St. Louis | 24 | 18 | .571 | 2.5 | L1 |
| <img src="https://a.espncdn.com/i/teamlogos/mlb/500/pit.png" class="logo-micro">Pittsburgh | 23 | 20 | .535 | 4 | L1 |
| <img src="https://a.espncdn.com/i/teamlogos/mlb/500/cin.png" class="logo-micro">Cincinnati | 22 | 21 | .512 | 5 | L2 |