
Cincinnati Reds at Los Angeles Angels
· Major League Baseball
Cincinnati Reds
6-7-1, 3-5 Away
<span class="badge bg-danger" style="font-size: 1.2em; margin: 5px 0;">Final</span>
6 - 7
6 - 7

Los Angeles Angels
9-4-1, 5-2 HomeHow To Watch
How can I watch Cincinnati Reds vs. Los Angeles Angels?
- TV Channel: Reds at Angels 2022 MLB Baseball, is broadcasted on MLB.tv.
- Online streaming: Sign up for Fubo.
Scoring Summary
 |
9th Inning | Aguilar singled to right, Ward scored. |
|
9th Inning | Ward doubled to left center. |
 |
9th Inning | Solomon relieved Kuhnel |
|
9th Inning | Quintana struck out swinging. |
|
9th Inning | Aquino doubled to deep center. |
|
9th Inning | Urbaez struck out looking. |
Statistics
 CIN CIN |
 LAA LAA |
|
|---|---|---|
| 1 | Games Played | 1 |
| 1 | Team Games Played | 1 |
| 0 | Hit By Pitch | 0 |
| 0 | Ground Balls | 0 |
| 11 | Strikeouts | 7 |
| 6 | Runs Batted In | 7 |
| 0 | Sacrifice Hit | 0 |
| 15 | Hits | 14 |
| 0 | Stolen Bases | 2 |
| 2 | Walks | 1 |
| 0 | Catcher Interference | 0 |
| 6 | Runs | 7 |
| 2 | Ground Into Double Play | 0 |
| 0 | Sacrifice Flies | 0 |
| 40 | At Bats | 37 |
| 3 | Home Runs | 1 |
| 0 | Grand Slam Home Runs | 0 |
| 23 | Runners Left On Base | 8 |
| 0 | Triples | 1 |
| 0 | Game Winning RBIs | 0 |
| 0 | Intentional Walks | 0 |
| 3 | Doubles | 4 |
| 0 | Fly Balls | 0 |
| 0 | Caught Stealing | 0 |
| 0 | Pitches | 0 |
| 0 | Games Started | 0 |
| 0 | Pinch At Bats | 0 |
| 0 | Pinch Hits | 0 |
| 0.0 | Player Rating | 0.0 |
| 1 | Is Qualified | 1 |
| 0 | Is Qualified In Steals | 1 |
| 27 | Total Bases | 23 |
| 42 | Plate Appearances | 38 |
| 486.0 | Projected Home Runs | 162.0 |
| 6 | Extra Base Hits | 6 |
| 9.1 | Runs Created | 8.8 |
| .375 | Batting Average | .378 |
| .000 | Pinch Hit Average | .000 |
| .675 | Slugging Percentage | .622 |
| .350 | Secondary Average | .324 |
| .405 | On Base Percentage | .395 |
| 1.080 | OBP Pct + SLG Pct | 1.016 |
| 0.0 | Ground To Fly Ball Ratio | 0.0 |
| 9.1 | Runs Created Per 27 Outs | 10.3 |
| 54.0 | Batter Rating | 57.5 |
| 13.3 | At Bats Per Home Run | 37.0 |
| 0.00 | Stolen Base Percentage | 1.00 |
| 0.00 | Pitches Per Plate Appearance | 0.00 |
| .300 | Isolated Power | .243 |
| 0.18 | Walk To Strikeout Ratio | 0.14 |
| .048 | Walks Per Plate Appearance | .026 |
| -.025 | Secondary Average Minus Batting Average | -.054 |
| 12.0 | Runs Produced | 14.0 |
| 1.0 | Runs Ratio | 1.0 |
| 0.7 | Patience Ratio | 0.6 |
| 0.5 | Balls In Play Average | 0.4 |
| 104.5 | MLB Rating | 103.3 |
| 0.0 | Offensive Wins Above Replacement | 0.0 |
| 0.0 | Wins Above Replacement | 0.0 |
Game Information
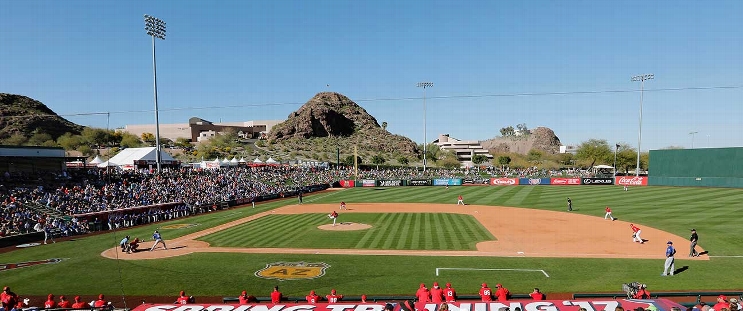
Tempe Diablo Stadium
Location: Tempe, Arizona
Attendance: 4,345 | Capacity:
2026 National League Central Standings
| TEAM | W | L | PCT | GB | STRK |
|---|---|---|---|---|---|
| <img src="https://a.espncdn.com/i/teamlogos/mlb/500/mil.png" class="logo-micro">Milwaukee | 59 | 37 | .615 | - | L3 |
| <img src="https://a.espncdn.com/i/teamlogos/mlb/500/chc.png" class="logo-micro">Chicago | 54 | 42 | .563 | 5 | W2 |
| <img src="https://a.espncdn.com/i/teamlogos/mlb/500/stl.png" class="logo-micro">St. Louis | 50 | 45 | .526 | 8.5 | L1 |
| <img src="https://a.espncdn.com/i/teamlogos/mlb/500/pit.png" class="logo-micro">Pittsburgh | 50 | 47 | .515 | 9.5 | W3 |
| <img src="https://a.espncdn.com/i/teamlogos/mlb/500/cin.png" class="logo-micro">Cincinnati | 43 | 52 | .453 | 15.5 | L2 |
2026 American League West Standings
| TEAM | W | L | PCT | GB | STRK |
|---|---|---|---|---|---|
| <img src="https://a.espncdn.com/i/teamlogos/mlb/500/tex.png" class="logo-micro">Texas | 49 | 47 | .510 | - | W1 |
| <img src="https://a.espncdn.com/i/teamlogos/mlb/500/sea.png" class="logo-micro">Seattle | 48 | 49 | .495 | 1.5 | W1 |
| <img src="https://a.espncdn.com/i/teamlogos/mlb/500/hou.png" class="logo-micro">Houston | 47 | 51 | .480 | 3 | L1 |
| <img src="https://a.espncdn.com/i/teamlogos/mlb/500/ath.png" class="logo-micro">Athletics | 41 | 55 | .427 | 8 | L9 |
| <img src="https://a.espncdn.com/i/teamlogos/mlb/500/laa.png" class="logo-micro">Los Angeles | 38 | 59 | .392 | 11.5 | L2 |