
Los Angeles Dodgers at Milwaukee Brewers
· Major League Baseball
Los Angeles Dodgers
0-1, 0-1 Away
<span class="badge bg-danger" style="font-size: 1.2em; margin: 5px 0;">Final</span>
4 - 7
4 - 7

Milwaukee Brewers
1-0, 1-0 HomeHow To Watch
How can I watch Los Angeles Dodgers vs. Milwaukee Brewers?
- TV Channel: Dodgers at Brewers 2022 MLB Baseball, is broadcasted on MLB.tv.
- Online streaming: Sign up for Fubo.
Scoring Summary
 |
9th Inning | Mazeika grounded out to second. |
|
9th Inning | Zimmer struck out swinging. |
|
9th Inning | Hernández struck out looking. |
 |
9th Inning | Hardy relieved Fernandez |
|
8th Inning | Alvarez struck out swinging. |
|
8th Inning | Bolt grounded out to shortstop. |
Statistics
 LAD LAD |
 MIL MIL |
|
|---|---|---|
| 1 | Games Played | 1 |
| 1 | Team Games Played | 1 |
| 0 | Hit By Pitch | 0 |
| 0 | Ground Balls | 0 |
| 8 | Strikeouts | 7 |
| 4 | Runs Batted In | 6 |
| 0 | Sacrifice Hit | 0 |
| 6 | Hits | 9 |
| 0 | Stolen Bases | 1 |
| 3 | Walks | 1 |
| 0 | Catcher Interference | 1 |
| 4 | Runs | 7 |
| 1 | Ground Into Double Play | 0 |
| 0 | Sacrifice Flies | 0 |
| 32 | At Bats | 32 |
| 1 | Home Runs | 3 |
| 0 | Grand Slam Home Runs | 0 |
| 14 | Runners Left On Base | 9 |
| 0 | Triples | 0 |
| 0 | Game Winning RBIs | 0 |
| 0 | Intentional Walks | 0 |
| 0 | Doubles | 0 |
| 0 | Fly Balls | 0 |
| 0 | Caught Stealing | 1 |
| 0 | Pitches | 0 |
| 0 | Games Started | 0 |
| 0 | Pinch At Bats | 0 |
| 0 | Pinch Hits | 0 |
| 0.0 | Player Rating | 0.0 |
| 1 | Is Qualified | 1 |
| 0 | Is Qualified In Steals | 1 |
| 9 | Total Bases | 18 |
| 35 | Plate Appearances | 34 |
| 162.0 | Projected Home Runs | 486.0 |
| 1 | Extra Base Hits | 3 |
| 2.0 | Runs Created | 5.3 |
| .188 | Batting Average | .281 |
| .000 | Pinch Hit Average | .000 |
| .281 | Slugging Percentage | .563 |
| .188 | Secondary Average | .313 |
| .257 | On Base Percentage | .303 |
| .538 | OBP Pct + SLG Pct | .866 |
| 0.0 | Ground To Fly Ball Ratio | 0.0 |
| 2.0 | Runs Created Per 27 Outs | 5.9 |
| 25.0 | Batter Rating | 45.0 |
| 32.0 | At Bats Per Home Run | 10.7 |
| 0.00 | Stolen Base Percentage | 0.50 |
| 0.00 | Pitches Per Plate Appearance | 0.00 |
| .094 | Isolated Power | .281 |
| 0.38 | Walk To Strikeout Ratio | 0.14 |
| .086 | Walks Per Plate Appearance | .029 |
| .000 | Secondary Average Minus Batting Average | .031 |
| 8.0 | Runs Produced | 13.0 |
| 1.0 | Runs Ratio | 0.9 |
| 0.4 | Patience Ratio | 0.6 |
| 0.2 | Balls In Play Average | 0.3 |
| 74.3 | MLB Rating | 91.8 |
| 0.0 | Offensive Wins Above Replacement | 0.0 |
| 0.0 | Wins Above Replacement | 0.0 |
Game Information
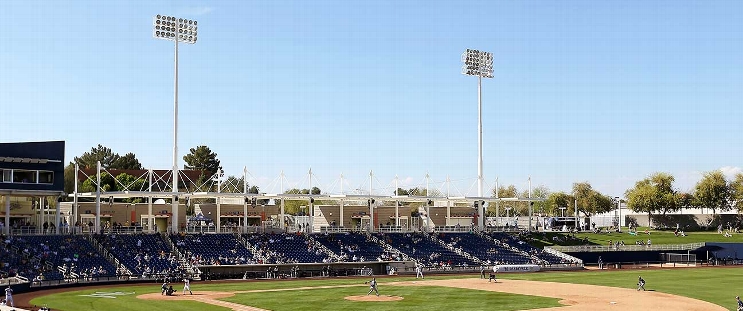
American Family Fields of Phoenix
Location: Phoenix, Arizona
Attendance: 8,098 | Capacity:
2026 National League West Standings
| TEAM | W | L | PCT | GB | STRK |
|---|---|---|---|---|---|
| <img src="https://a.espncdn.com/i/teamlogos/mlb/500/lad.png" class="logo-micro">Los Angeles | 56 | 31 | .644 | - | L1 |
| <img src="https://a.espncdn.com/i/teamlogos/mlb/500/sd.png" class="logo-micro">San Diego | 43 | 42 | .506 | 12 | L5 |
| <img src="https://a.espncdn.com/i/teamlogos/mlb/500/ari.png" class="logo-micro">Arizona | 43 | 43 | .500 | 12.5 | L1 |
| <img src="https://a.espncdn.com/i/teamlogos/mlb/500/sf.png" class="logo-micro">San Francisco | 36 | 50 | .419 | 19.5 | W1 |
| <img src="https://a.espncdn.com/i/teamlogos/mlb/500/col.png" class="logo-micro">Colorado | 34 | 53 | .391 | 22 | W1 |
2026 National League Central Standings
| TEAM | W | L | PCT | GB | STRK |
|---|---|---|---|---|---|
| <img src="https://a.espncdn.com/i/teamlogos/mlb/500/mil.png" class="logo-micro">Milwaukee | 53 | 31 | .631 | - | W3 |
| <img src="https://a.espncdn.com/i/teamlogos/mlb/500/chc.png" class="logo-micro">Chicago | 49 | 38 | .563 | 5.5 | W5 |
| <img src="https://a.espncdn.com/i/teamlogos/mlb/500/stl.png" class="logo-micro">St. Louis | 44 | 39 | .530 | 8.5 | L1 |
| <img src="https://a.espncdn.com/i/teamlogos/mlb/500/pit.png" class="logo-micro">Pittsburgh | 43 | 44 | .494 | 11.5 | L2 |
| <img src="https://a.espncdn.com/i/teamlogos/mlb/500/cin.png" class="logo-micro">Cincinnati | 39 | 46 | .459 | 14.5 | L4 |