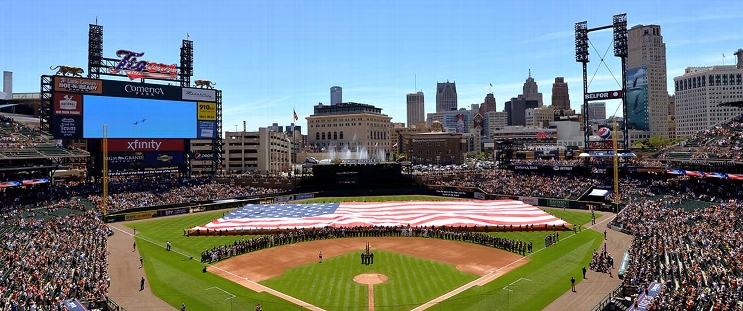
Washington Nationals at Detroit Tigers
· Major League Baseball
2 - 7

Nathaniel Lowe's 3-run triple helps Nationals past AL-leading Tigers 9-4 for a doubleheader split
Josh Bell had three RBI for Washington, which won at home for only the second time in 11 games since June 7.
Jahmai Jones drove in two for AL-leading Detroit. The Tigers had won three in a row, including an 11-2 victory in the first game as Riley Greene hit two homers and tied a career high with six RBI.
Detroit had retired 13 consecutive Nationals when Tommy Kahnle (0-1) entered in the eighth. With the Tigers leading 4-3, he gave up two singles and a walk before Lowe pulled one down the right-field line to clear the bases. Lowe scored on Bell’s double to left-center, which ended Kahnle’s outing.
The Nationals scored twice more when Paul DeJong greeted reliever Brenan Hanifee with an RBI single and came around on Jacob Young’s one-out grounder.
Cole Henry (1-1) pitched a scoreless eighth for his first major league victory.
Lowe and Bell had RBI singles in the first inning against Jack Flaherty, and Bell added another run-scoring hit in the third.
Flaherty allowed three runs in five innings while striking out nine, including the last seven Nationals he faced.
Spencer Torkelson hit a run-scoring double in the fourth for Detroit and pinch-hitter Colt Keith added an RBI double in the sixth. Jones’ two-run double in the seventh gave the Tigers the lead.
Washington starter MacKenzie Gore allowed two runs in 5 1/3 innings while striking out a season-low two.
How can I watch Washington Nationals vs. Detroit Tigers?
- TV Channel: Nationals at Tigers 2022 MLB Baseball, is broadcasted on MLB.tv.
- Online streaming: Sign up for Fubo.
Scoring Summary
 |
9th Inning | L. García Jr. struck out swinging. |
 |
9th Inning | Meneses struck out swinging. |
 |
9th Inning | Lipscomb struck out swinging. |
 |
9th Inning | Chafin relieved Holton |
 |
9th Inning | Lipscomb hit for Rosario |
 |
8th Inning | Vierling grounded out to second. |
Statistics
 WSH WSH |
 DET DET |
|
|---|---|---|
| 1 | Games Played | 1 |
| 1 | Team Games Played | 1 |
| 0 | Hit By Pitch | 2 |
| 8 | Ground Balls | 12 |
| 8 | Strikeouts | 6 |
| 2 | Runs Batted In | 7 |
| 0 | Sacrifice Hit | 0 |
| 5 | Hits | 10 |
| 0 | Stolen Bases | 1 |
| 2 | Walks | 3 |
| 0 | Catcher Interference | 0 |
| 2 | Runs | 7 |
| 0 | Ground Into Double Play | 2 |
| 2 | Sacrifice Flies | 1 |
| 29 | At Bats | 31 |
| 0 | Home Runs | 1 |
| 0 | Grand Slam Home Runs | 0 |
| 7 | Runners Left On Base | 13 |
| 0 | Triples | 0 |
| 0 | Game Winning RBIs | 1 |
| 0 | Intentional Walks | 0 |
| 2 | Doubles | 2 |
| 15 | Fly Balls | 14 |
| 1 | Caught Stealing | 0 |
| 133 | Pitches | 155 |
| 0 | Games Started | 0 |
| 1 | Pinch At Bats | 0 |
| 0 | Pinch Hits | 0 |
| 0.0 | Player Rating | 0.0 |
| 1 | Is Qualified | 1 |
| 1 | Is Qualified In Steals | 1 |
| 7 | Total Bases | 15 |
| 33 | Plate Appearances | 37 |
| 0.0 | Projected Home Runs | 162.0 |
| 2 | Extra Base Hits | 3 |
| 1.1 | Runs Created | 5.9 |
| .172 | Batting Average | .323 |
| .000 | Pinch Hit Average | .000 |
| .241 | Slugging Percentage | .484 |
| .103 | Secondary Average | .290 |
| .212 | On Base Percentage | .405 |
| .454 | OBP Pct + SLG Pct | .889 |
| 0.5 | Ground To Fly Ball Ratio | 0.9 |
| 1.1 | Runs Created Per 27 Outs | 6.7 |
| 17.0 | Batter Rating | 46.0 |
| 0.0 | At Bats Per Home Run | 31.0 |
| 0.00 | Stolen Base Percentage | 1.00 |
| 4.03 | Pitches Per Plate Appearance | 4.19 |
| .069 | Isolated Power | .161 |
| 0.25 | Walk To Strikeout Ratio | 0.50 |
| .061 | Walks Per Plate Appearance | .081 |
| -.069 | Secondary Average Minus Batting Average | -.032 |
| 4.0 | Runs Produced | 14.0 |
| 1.0 | Runs Ratio | 1.0 |
| 0.3 | Patience Ratio | 0.6 |
| 0.2 | Balls In Play Average | 0.4 |
| 67.8 | MLB Rating | 93.0 |
| 0.0 | Offensive Wins Above Replacement | 0.0 |
| 0.0 | Wins Above Replacement | 0.0 |
Game Information

Location: Detroit, Michigan
Attendance: 21,925 | Capacity:
2025 National League East Standings
| TEAM | W | L | PCT | GB | STRK |
|---|---|---|---|---|---|
 Philadelphia Philadelphia |
96 | 66 | .593 | - | W1 |
 New York New York |
83 | 79 | .512 | 13 | L1 |
 Miami Miami |
79 | 83 | .488 | 17 | W1 |
 Atlanta Atlanta |
76 | 86 | .469 | 20 | W1 |
 Washington Washington |
66 | 96 | .407 | 30 | L1 |
2025 American League Central Standings
| TEAM | W | L | PCT | GB | STRK |
|---|---|---|---|---|---|
 Cleveland Cleveland |
88 | 74 | .543 | - | W2 |
 Detroit Detroit |
87 | 75 | .537 | 1 | L1 |
 Kansas City Kansas City |
82 | 80 | .506 | 6 | W2 |
 Minnesota Minnesota |
70 | 92 | .432 | 18 | L1 |
 Chicago Chicago |
60 | 102 | .370 | 28 | W1 |