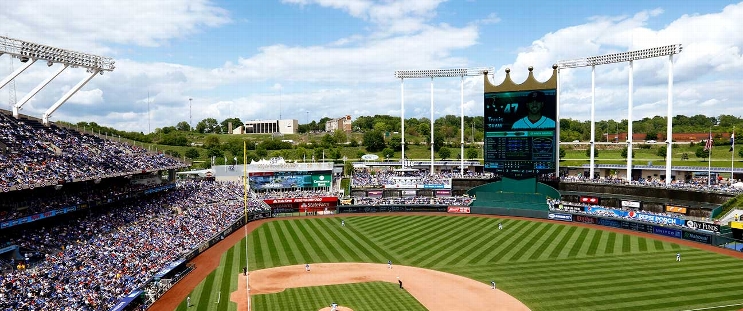
Baltimore Orioles at Kansas City Royals
· Major League Baseball
1 - 4

Bubic takes a shutout into the seventh to pitch Royals past Orioles 4-1

Bubic (2-0) allowed five hits, walked one and struck out eight in 6 2/3 innings. His streak of 12 shutout innings was snapped when Ryan Mountcastle tripled to lead off the seventh and scored on Bubic's wild pitch one out later.
Bobby Witt Jr. had three of the Royals' 13 hits, falling a home run shy of the cycle. Salvador Perez, Mark Canha and Maikel Garcia each had two hits and scored a run.
Carlos Estévez earned his second save with a hitless ninth for the Royals. Kansas City, which swept Baltimore in the wild-card round last year, won its first regular-season series against the Orioles since Aug. 30 to Sept. 1, 2019, after having lost six of the last eight series with two ties.
Jorge Mateo – starting in center field for the first time since April 20, 2024 – misplayed Witt’s slicing liner into a triple, keying Kansas City’s three-run first inning.
Freddy Fermin’s second-inning RBI single snapped an 0-for-12 skid as eight of the Royals' first 11 batters hit safely and Kansas City took a 4-0 lead.
Orioles starter Cade Povich (0-1) allowed four runs and a career-high 13 hits in six innings with four strikeouts.
Mountcastle had three of the Orioles' five hits.
Royals: Begin a four-game homestand with Minnesota as Twins RHP Simeon Woods Richardson (0-0, 4.50) faces RHP Michael Lorenzen (0-1, 5.06).
—
How can I watch Baltimore Orioles vs. Kansas City Royals?
- TV Channel: Orioles at Royals 2022 MLB Baseball, is broadcasted on MLB.TV.
- Online streaming: Sign up for Fubo.
Scoring Summary
 |
9th Inning | Mountcastle lined out to second. |
 |
9th Inning | O'Neill popped out to shortstop. |
 |
9th Inning | Westburg struck out swinging. |
 |
9th Inning | Estévez relieved Erceg |
 |
9th Inning | Melendez in right field. |
 |
8th Inning | Garcia lined out to right. |
Statistics
 BAL BAL |
 KC KC |
|
|---|---|---|
| 1 | Games Played | 1 |
| 1 | Team Games Played | 1 |
| 0 | Hit By Pitch | 0 |
| 5 | Ground Balls | 9 |
| 12 | Strikeouts | 7 |
| 0 | Runs Batted In | 4 |
| 0 | Sacrifice Hit | 0 |
| 4 | Hits | 12 |
| 0 | Stolen Bases | 2 |
| 1 | Walks | 1 |
| 0 | Catcher Interference | 0 |
| 1 | Runs | 4 |
| 1 | Ground Into Double Play | 1 |
| 0 | Sacrifice Flies | 1 |
| 31 | At Bats | 33 |
| 0 | Home Runs | 0 |
| 0 | Grand Slam Home Runs | 0 |
| 9 | Runners Left On Base | 14 |
| 0 | Triples | 0 |
| 0 | Game Winning RBIs | 1 |
| 0 | Intentional Walks | 0 |
| 0 | Doubles | 3 |
| 14 | Fly Balls | 18 |
| 0 | Caught Stealing | 0 |
| 131 | Pitches | 117 |
| 0 | Games Started | 0 |
| 1 | Pinch At Bats | 1 |
| 0 | Pinch Hits | 0 |
| 0.0 | Player Rating | 0.0 |
| 1 | Is Qualified | 1 |
| 0 | Is Qualified In Steals | 1 |
| 4 | Total Bases | 15 |
| 32 | Plate Appearances | 35 |
| 0.0 | Projected Home Runs | 0.0 |
| 0 | Extra Base Hits | 3 |
| -0.8 | Runs Created | 5.6 |
| .129 | Batting Average | .364 |
| .000 | Pinch Hit Average | .000 |
| .129 | Slugging Percentage | .455 |
| .032 | Secondary Average | .182 |
| .156 | On Base Percentage | .371 |
| .285 | OBP Pct + SLG Pct | .826 |
| 0.4 | Ground To Fly Ball Ratio | 0.5 |
| -0.7 | Runs Created Per 27 Outs | 6.6 |
| 6.0 | Batter Rating | 36.0 |
| 0.0 | At Bats Per Home Run | 0.0 |
| 0.00 | Stolen Base Percentage | 1.00 |
| 4.09 | Pitches Per Plate Appearance | 3.34 |
| .000 | Isolated Power | .091 |
| 0.08 | Walk To Strikeout Ratio | 0.14 |
| .031 | Walks Per Plate Appearance | .029 |
| -.097 | Secondary Average Minus Batting Average | -.182 |
| 1.0 | Runs Produced | 8.0 |
| 0.0 | Runs Ratio | 1.0 |
| 0.2 | Patience Ratio | 0.5 |
| 0.2 | Balls In Play Average | 0.5 |
| 58.5 | MLB Rating | 88.0 |
| 0.0 | Offensive Wins Above Replacement | 0.0 |
| 0.0 | Wins Above Replacement | 0.0 |
Game Information

Location: Kansas City, Missouri
Attendance: 19,098 | Capacity:
2025 American League East Standings
| TEAM | W | L | PCT | GB | STRK |
|---|---|---|---|---|---|
 Toronto Toronto |
94 | 68 | .580 | - | W4 |
 New York New York |
94 | 68 | .580 | - | W8 |
 Boston Boston |
89 | 73 | .549 | 5 | W1 |
 Tampa Bay Tampa Bay |
77 | 85 | .475 | 17 | L4 |
 Baltimore Baltimore |
75 | 87 | .463 | 19 | L3 |
2025 American League Central Standings
| TEAM | W | L | PCT | GB | STRK |
|---|---|---|---|---|---|
 Cleveland Cleveland |
88 | 74 | .543 | - | W2 |
 Detroit Detroit |
87 | 75 | .537 | 1 | L1 |
 Kansas City Kansas City |
82 | 80 | .506 | 6 | W2 |
 Minnesota Minnesota |
70 | 92 | .432 | 18 | L1 |
 Chicago Chicago |
60 | 102 | .370 | 28 | W1 |