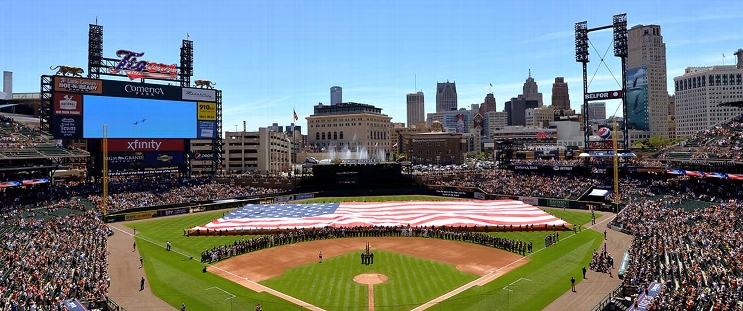
Baltimore Orioles at Detroit Tigers
· Doubleheader - Game 1
3 - 4

Torkelson's 8th homer helps Tigers beat Orioles 4-3 in first game of day-night doubleheader

Detroit improved to 11-3 at home while Baltimore lost for the fourth time in five games, going 1 for 8 with runners in scoring position.
Casey Mize (4-1) allowed one run and eight hits in 5 1/3 innings, struck out five and walked none. Will Vest got four outs for his third save.
Brandon Young (0-1), a 26-year-old right-hander making his second major league start, gave up three runs, four hits and five walks in 4 2/3 innings.
Báez's RBI double and Gleyber Torres' sacrifice fly built a 2-0 lead in the first.
Ryan O'Hearn hit a solo homer in the fourth but Jace Jung boosted the lead to 3-1 with an RBI single in the fifth.
Left fielder Riley Greene reached over the top of the fence to steal a homer from Ramón Laureano in the seventh, and Jordan Westburg's RBI single later in the inning cut Baltimore's deficit.
Torkelson homered in the seventh off Cionel Pérez and Baltimore's Ramón Urías in the eighth against Tyler Holton.
Detroit successfully challenged two calls by first-base umpire Brian O’Nora, overturning what out call on Dillon Dingler on a second-inning pickoff and on Báez on his fourth-inning grounder to shortstop Gunnar Henderson.
How can I watch Baltimore Orioles vs. Detroit Tigers?
- TV Channel: Orioles at Tigers 2022 MLB Baseball, is broadcasted on MLBN.
- Online streaming: Sign up for Fubo.
Scoring Summary
 |
9th Inning | Westburg struck out swinging. |
 |
9th Inning | Henderson struck out swinging. |
 |
9th Inning | Mullins flied out to left. |
 |
8th Inning | Torres flied out to right. |
 |
8th Inning | Carpenter lined out to left. |
 |
8th Inning | Báez singled to left. |
Statistics
 BAL BAL |
 DET DET |
|
|---|---|---|
| 1 | Games Played | 1 |
| 1 | Team Games Played | 1 |
| 0 | Hit By Pitch | 0 |
| 13 | Ground Balls | 6 |
| 10 | Strikeouts | 11 |
| 3 | Runs Batted In | 4 |
| 0 | Sacrifice Hit | 0 |
| 11 | Hits | 8 |
| 0 | Stolen Bases | 0 |
| 2 | Walks | 6 |
| 0 | Catcher Interference | 0 |
| 3 | Runs | 4 |
| 1 | Ground Into Double Play | 0 |
| 0 | Sacrifice Flies | 1 |
| 37 | At Bats | 31 |
| 2 | Home Runs | 1 |
| 0 | Grand Slam Home Runs | 0 |
| 17 | Runners Left On Base | 15 |
| 0 | Triples | 0 |
| 0 | Game Winning RBIs | 1 |
| 0 | Intentional Walks | 0 |
| 0 | Doubles | 2 |
| 14 | Fly Balls | 15 |
| 1 | Caught Stealing | 0 |
| 170 | Pitches | 151 |
| 0 | Games Started | 0 |
| 2 | Pinch At Bats | 1 |
| 0 | Pinch Hits | 0 |
| 0.0 | Player Rating | 0.0 |
| 1 | Is Qualified | 1 |
| 1 | Is Qualified In Steals | 0 |
| 17 | Total Bases | 13 |
| 39 | Plate Appearances | 38 |
| 324.0 | Projected Home Runs | 162.0 |
| 2 | Extra Base Hits | 3 |
| 4.9 | Runs Created | 5.4 |
| .297 | Batting Average | .258 |
| .000 | Pinch Hit Average | .000 |
| .459 | Slugging Percentage | .419 |
| .189 | Secondary Average | .355 |
| .333 | On Base Percentage | .368 |
| .793 | OBP Pct + SLG Pct | .788 |
| 0.9 | Ground To Fly Ball Ratio | 0.4 |
| 4.7 | Runs Created Per 27 Outs | 6.1 |
| 29.0 | Batter Rating | 31.0 |
| 18.5 | At Bats Per Home Run | 31.0 |
| 0.00 | Stolen Base Percentage | 0.00 |
| 4.36 | Pitches Per Plate Appearance | 3.97 |
| .162 | Isolated Power | .161 |
| 0.20 | Walk To Strikeout Ratio | 0.55 |
| .051 | Walks Per Plate Appearance | .158 |
| -.108 | Secondary Average Minus Batting Average | .097 |
| 6.0 | Runs Produced | 8.0 |
| 1.0 | Runs Ratio | 1.0 |
| 0.5 | Patience Ratio | 0.5 |
| 0.4 | Balls In Play Average | 0.4 |
| 84.3 | MLB Rating | 81.3 |
| 0.0 | Offensive Wins Above Replacement | 0.0 |
| 0.0 | Wins Above Replacement | 0.0 |
Game Information

Location: Detroit, Michigan
Attendance: 28,509 | Capacity:
2025 American League East Standings
| TEAM | W | L | PCT | GB | STRK |
|---|---|---|---|---|---|
 New York New York |
18 | 12 | .600 | - | W1 |
 Boston Boston |
17 | 14 | .548 | 1.5 | W3 |
 Tampa Bay Tampa Bay |
14 | 15 | .483 | 3.5 | L1 |
 Toronto Toronto |
13 | 16 | .448 | 4.5 | L3 |
 Baltimore Baltimore |
11 | 18 | .379 | 6.5 | L1 |
2025 American League Central Standings
| TEAM | W | L | PCT | GB | STRK |
|---|---|---|---|---|---|
 Detroit Detroit |
18 | 12 | .600 | - | L2 |
 Cleveland Cleveland |
16 | 13 | .552 | 1.5 | W1 |
 Kansas City Kansas City |
15 | 15 | .500 | 3 | W1 |
 Minnesota Minnesota |
13 | 17 | .433 | 5 | L1 |
 Chicago Chicago |
7 | 22 | .241 | 10.5 | L2 |