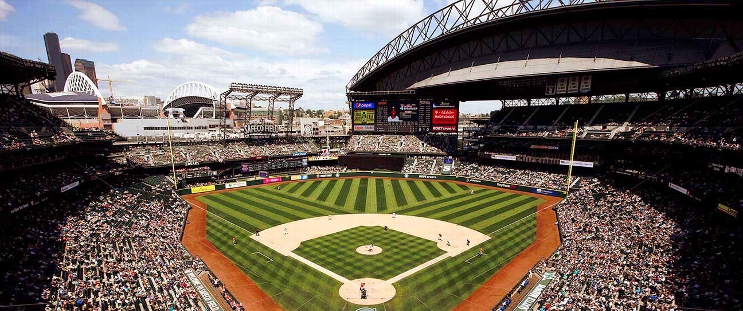
Miami Marlins at Seattle Mariners
· Major League Baseball
6 - 7

Cal Raleigh hits 10th homer, Logan Evans wins in debut as the Mariners beat the Marlins 7-6

Connor Norby's three-run homer in the eighth cut Seattle's lead before Andrés Muñoz pitched a 1-2-3 ninth for his 10th save, tying San Diego's Robert Suarez atop the majors.
The Mariners have won six straight series and 12 of their last 16 games.
Raleigh's homer tied Arizona's Eugenio Suárez. J.P. Crawford also homered. Jorge Polanco had three hits, including two doubles, and two RBI. Julio Rodriguez hit a two-run single.
Evans (1-0) made his debut after All-Star right-hander Logan Gilbert went on the 15-day injured list Saturday with a right elbow flexor strain. Evans gave up two runs on two hits and three walks with three strikeouts.
Seattle's Randy Arozarena reached base for the 23rd consecutive game, the second-longest active streak behind Philadelphia’s Kyle Schwarber (32), who played Sunday night.
Norby had three hits and three RBI. Agustín Ramírez hit two solo homers, but grounded out to end the game. Max Meyer (2-3) pitched four innings and gave up five runs.
Ben Williamson was scratched from the Mariners' lineup with back spasms. The third baseman missed his first game since making his MLB debut April 15. He is hitting .310.
How can I watch Miami Marlins vs. Seattle Mariners?
- TV Channel: Marlins at Mariners 2022 MLB Baseball, is broadcasted on MLB.TV.
- Online streaming: Sign up for Fubo.
Scoring Summary
 |
9th Inning | Ramírez grounded out to second. |
 |
9th Inning | J. Sánchez grounded out to second. |
 |
9th Inning | Edwards struck out looking. |
 |
9th Inning | Muñoz relieved Thornton |
 |
8th Inning | Arozarena popped out to shortstop. |
 |
8th Inning | Raleigh flied out to right. |
Statistics
 MIA MIA |
 SEA SEA |
|
|---|---|---|
| 1 | Games Played | 1 |
| 1 | Team Games Played | 1 |
| 0 | Hit By Pitch | 2 |
| 12 | Ground Balls | 6 |
| 7 | Strikeouts | 11 |
| 6 | Runs Batted In | 7 |
| 1 | Sacrifice Hit | 0 |
| 9 | Hits | 9 |
| 0 | Stolen Bases | 0 |
| 3 | Walks | 5 |
| 0 | Catcher Interference | 0 |
| 6 | Runs | 7 |
| 0 | Ground Into Double Play | 0 |
| 0 | Sacrifice Flies | 0 |
| 35 | At Bats | 33 |
| 3 | Home Runs | 2 |
| 0 | Grand Slam Home Runs | 0 |
| 13 | Runners Left On Base | 18 |
| 0 | Triples | 0 |
| 0 | Game Winning RBIs | 1 |
| 0 | Intentional Walks | 0 |
| 1 | Doubles | 3 |
| 17 | Fly Balls | 16 |
| 0 | Caught Stealing | 0 |
| 139 | Pitches | 168 |
| 0 | Games Started | 0 |
| 0 | Pinch At Bats | 0 |
| 0 | Pinch Hits | 0 |
| 0.0 | Player Rating | 0.0 |
| 1 | Is Qualified | 1 |
| 0 | Is Qualified In Steals | 0 |
| 19 | Total Bases | 18 |
| 39 | Plate Appearances | 40 |
| 486.0 | Projected Home Runs | 324.0 |
| 4 | Extra Base Hits | 5 |
| 6.1 | Runs Created | 7.4 |
| .257 | Batting Average | .273 |
| .000 | Pinch Hit Average | .000 |
| .543 | Slugging Percentage | .545 |
| .371 | Secondary Average | .424 |
| .316 | On Base Percentage | .400 |
| .859 | OBP Pct + SLG Pct | .945 |
| 0.7 | Ground To Fly Ball Ratio | 0.4 |
| 6.1 | Runs Created Per 27 Outs | 8.3 |
| 44.0 | Batter Rating | 49.0 |
| 11.7 | At Bats Per Home Run | 16.5 |
| 0.00 | Stolen Base Percentage | 0.00 |
| 3.56 | Pitches Per Plate Appearance | 4.20 |
| .286 | Isolated Power | .273 |
| 0.43 | Walk To Strikeout Ratio | 0.45 |
| .077 | Walks Per Plate Appearance | .125 |
| .114 | Secondary Average Minus Batting Average | .152 |
| 12.0 | Runs Produced | 14.0 |
| 1.0 | Runs Ratio | 1.0 |
| 0.6 | Patience Ratio | 0.7 |
| 0.2 | Balls In Play Average | 0.4 |
| 91.8 | MLB Rating | 93.0 |
| 0.0 | Offensive Wins Above Replacement | 0.0 |
| 0.0 | Wins Above Replacement | 0.0 |
Game Information

Location: Seattle, Washington
Attendance: 30,361 | Capacity:
2025 National League East Standings
| TEAM | W | L | PCT | GB | STRK |
|---|---|---|---|---|---|
 New York New York |
21 | 9 | .700 | - | W2 |
 Philadelphia Philadelphia |
16 | 13 | .552 | 4.5 | W3 |
 Atlanta Atlanta |
14 | 15 | .483 | 6.5 | W2 |
 Washington Washington |
13 | 17 | .433 | 8 | L2 |
 Miami Miami |
12 | 17 | .414 | 8.5 | L4 |
2025 American League West Standings
| TEAM | W | L | PCT | GB | STRK |
|---|---|---|---|---|---|
 Seattle Seattle |
17 | 12 | .586 | - | W3 |
 Houston Houston |
16 | 13 | .552 | 1 | W3 |
 Texas Texas |
16 | 14 | .533 | 1.5 | W1 |
 Athletics Athletics |
15 | 15 | .500 | 2.5 | L1 |
 Los Angeles Los Angeles |
12 | 16 | .429 | 4.5 | L4 |