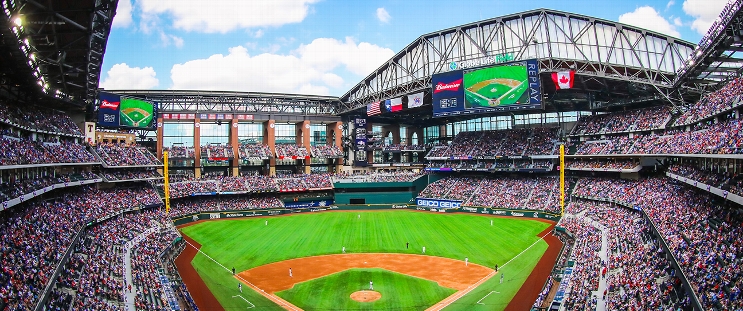
Athletics at Texas Rangers
· Major League Baseball
7 - 1

Athletics bust out in 9th with 2-run homer by Rooker and grand slam by Butler, beat Rangers 7-1

Rooker was the first batter to face Luke Jackson after Tyler Soderstrom led off the inning with a single off Robert Garcia (1-1). Rooker launched a 1-1 fastball to left field, his eighth of the season. After the A’s loaded the bases with a single and two walks by Jackson, Butler took Shawn Armstrong deep to center for his fifth homer.
Grant Holman (3-0) pitched a scoreless seventh and eighth.
The Athletics have won six of eight, while the Rangers have lost eight of 12.
Jacob Wilson gave the A’s a 1-0 lead in the third inning with a perfectly placed bunt single between the mound and first base to score JJ Bleday, who opened the inning with a double off the right-field wall.
Adolis García singled home Marcus Semien in the fourth, tying it at 1-all.
Texas starter Nathan Eovaldi allowed one run and six hits in six innings, striking out eight and walking none. He has 46 strikeouts and three walks, a 15.33 strikeout-to-walk ratio that leads the majors.
Athletics starter Luis Severino allowed one run and eight hits in five innings, leaving after allowing back-to-back singles opening the sixth.
Texas’ offense regressed after scoring a season-high 15 runs Tuesday following a stretch of scoring only 11 runs over six games.
How can I watch Athletics vs. Texas Rangers?
- TV Channel: Athletics at Rangers 2022 MLB Baseball, is broadcasted on MLB.TV.
- Online streaming: Sign up for Fubo.
Scoring Summary
 |
9th Inning | Burger struck out looking. |
 |
9th Inning | Smith grounded out to second. |
 |
9th Inning | Langford flied out to left. |
 |
9th Inning | Ferguson relieved Holman |
 |
9th Inning | Brown in left field. |
 |
9th Inning | Wilson grounded out to third. |
Statistics
 ATH ATH |
 TEX TEX |
|
|---|---|---|
| 1 | Games Played | 1 |
| 1 | Team Games Played | 1 |
| 0 | Hit By Pitch | 0 |
| 0 | Ground Balls | 0 |
| 10 | Strikeouts | 9 |
| 7 | Runs Batted In | 1 |
| 0 | Sacrifice Hit | 1 |
| 11 | Hits | 9 |
| 0 | Stolen Bases | 0 |
| 2 | Walks | 3 |
| 0 | Catcher Interference | 0 |
| 7 | Runs | 1 |
| 2 | Ground Into Double Play | 0 |
| 0 | Sacrifice Flies | 0 |
| 36 | At Bats | 35 |
| 2 | Home Runs | 0 |
| 1 | Grand Slam Home Runs | 0 |
| 13 | Runners Left On Base | 27 |
| 0 | Triples | 0 |
| 0 | Game Winning RBIs | 0 |
| 0 | Intentional Walks | 0 |
| 1 | Doubles | 0 |
| 0 | Fly Balls | 0 |
| 0 | Caught Stealing | 0 |
| 146 | Pitches | 159 |
| 0 | Games Started | 0 |
| 0 | Pinch At Bats | 0 |
| 0 | Pinch Hits | 0 |
| 0.0 | Player Rating | 0.0 |
| 1 | Is Qualified | 1 |
| 0 | Is Qualified In Steals | 0 |
| 18 | Total Bases | 9 |
| 38 | Plate Appearances | 39 |
| 324.0 | Projected Home Runs | 0.0 |
| 3 | Extra Base Hits | 0 |
| 5.3 | Runs Created | 3.1 |
| .306 | Batting Average | .257 |
| .000 | Pinch Hit Average | .000 |
| .500 | Slugging Percentage | .257 |
| .250 | Secondary Average | .086 |
| .342 | On Base Percentage | .316 |
| .842 | OBP Pct + SLG Pct | .573 |
| 0.0 | Ground To Fly Ball Ratio | 0.0 |
| 5.3 | Runs Created Per 27 Outs | 3.1 |
| 47.0 | Batter Rating | 13.0 |
| 18.0 | At Bats Per Home Run | 0.0 |
| 0.00 | Stolen Base Percentage | 0.00 |
| 3.84 | Pitches Per Plate Appearance | 4.08 |
| .194 | Isolated Power | .000 |
| 0.20 | Walk To Strikeout Ratio | 0.33 |
| .053 | Walks Per Plate Appearance | .077 |
| -.056 | Secondary Average Minus Batting Average | -.171 |
| 14.0 | Runs Produced | 2.0 |
| 1.0 | Runs Ratio | 1.0 |
| 0.5 | Patience Ratio | 0.3 |
| 0.4 | Balls In Play Average | 0.3 |
| 93.8 | MLB Rating | 71.3 |
| 0.0 | Offensive Wins Above Replacement | 0.0 |
| 0.0 | Wins Above Replacement | 0.0 |
Game Information

Location: Arlington, Texas
Attendance: 19,803 | Capacity:
2025 American League West Standings
| TEAM | W | L | PCT | GB | STRK |
|---|---|---|---|---|---|
 Seattle Seattle |
18 | 12 | .600 | - | W4 |
 Houston Houston |
16 | 14 | .533 | 2 | L1 |
 Athletics Athletics |
17 | 15 | .531 | 2 | W2 |
 Texas Texas |
16 | 16 | .500 | 3 | L2 |
 Los Angeles Los Angeles |
12 | 18 | .400 | 6 | L6 |