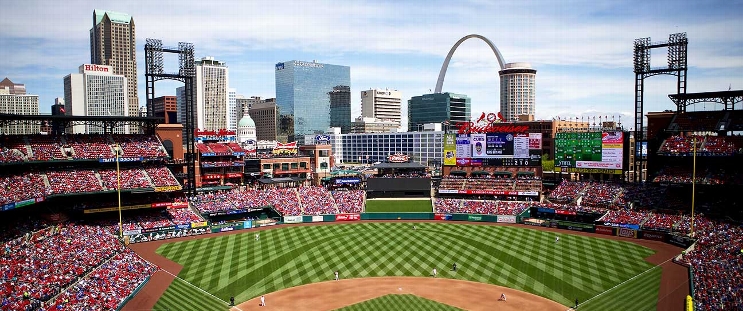
New York Mets at St. Louis Cardinals
· Major League Baseball
9 - 3

Alonso and Nimmo homer, Mets beat Cardinals 9-3 for ninth straight win over St. Louis

Francisco Alvarez added three singles and three RBI to back Clay Holmes (4-1), and New York got its first win over Sonny Gray (3-1), who had been 4-0 against the Mets.
Alonso put the Mets ahead 4-3 with his eighth homer, a two-run drive on an 0-2 changeup he drove 417 feet into the center-field bleachers.
Nimmo homered leading off the seventh against John King, his seventh home run, and the Mets finished with 17 hits for their second-highest total this season.
New York swept a four-game series from the Cardinals at home last month. The Mets' previous best streak against the Cardinals was an eight-game run in 1986.
Holmes allowed three runs and eight hits in six innings. He was struck on the right ankle by Alec Burleson’s comebacker in the second inning.
Gray gave up five runs — four earned — nine hits and three walks in a season-low 4 1/3 innings.
Masyn Winn had three hits, an RBI. He scored on Willson Contreras’ third-inning single to give St. Louis a 3-2 lead. Holmes retired his next eight batters.
How can I watch New York Mets vs. St. Louis Cardinals?
- TV Channel: Mets at Cardinals 2022 MLB Baseball, is broadcasted on MLB.TV.
- Online streaming: Sign up for Fubo.
Scoring Summary
 |
9th Inning | Pagés grounded out to shortstop. |
 |
9th Inning | Gorman struck out swinging. |
 |
9th Inning | Burleson lined out to center. |
 |
9th Inning | Stanek relieved Buttó |
 |
9th Inning | Lindor grounded out to second. |
 |
9th Inning | Acuña hit sacrifice fly to right, Taylor scored. |
Statistics
 NYM NYM |
 STL STL |
|
|---|---|---|
| 1 | Games Played | 1 |
| 1 | Team Games Played | 1 |
| 1 | Hit By Pitch | 0 |
| 12 | Ground Balls | 12 |
| 8 | Strikeouts | 5 |
| 8 | Runs Batted In | 2 |
| 0 | Sacrifice Hit | 0 |
| 17 | Hits | 9 |
| 0 | Stolen Bases | 2 |
| 4 | Walks | 1 |
| 0 | Catcher Interference | 0 |
| 9 | Runs | 3 |
| 2 | Ground Into Double Play | 1 |
| 1 | Sacrifice Flies | 0 |
| 40 | At Bats | 34 |
| 2 | Home Runs | 0 |
| 0 | Grand Slam Home Runs | 0 |
| 17 | Runners Left On Base | 13 |
| 0 | Triples | 0 |
| 1 | Game Winning RBIs | 0 |
| 0 | Intentional Walks | 0 |
| 3 | Doubles | 2 |
| 21 | Fly Balls | 17 |
| 1 | Caught Stealing | 1 |
| 173 | Pitches | 124 |
| 0 | Games Started | 0 |
| 1 | Pinch At Bats | 0 |
| 0 | Pinch Hits | 0 |
| 0.0 | Player Rating | 0.0 |
| 1 | Is Qualified | 1 |
| 1 | Is Qualified In Steals | 1 |
| 26 | Total Bases | 11 |
| 46 | Plate Appearances | 35 |
| 324.0 | Projected Home Runs | 0.0 |
| 5 | Extra Base Hits | 2 |
| 10.4 | Runs Created | 2.8 |
| .425 | Batting Average | .265 |
| .000 | Pinch Hit Average | .000 |
| .650 | Slugging Percentage | .324 |
| .300 | Secondary Average | .118 |
| .478 | On Base Percentage | .286 |
| 1.128 | OBP Pct + SLG Pct | .609 |
| 0.6 | Ground To Fly Ball Ratio | 0.7 |
| 10.4 | Runs Created Per 27 Outs | 2.8 |
| 63.0 | Batter Rating | 25.0 |
| 20.0 | At Bats Per Home Run | 0.0 |
| 0.00 | Stolen Base Percentage | 0.67 |
| 3.76 | Pitches Per Plate Appearance | 3.54 |
| .225 | Isolated Power | .059 |
| 0.50 | Walk To Strikeout Ratio | 0.20 |
| .087 | Walks Per Plate Appearance | .029 |
| -.125 | Secondary Average Minus Batting Average | -.147 |
| 17.0 | Runs Produced | 5.0 |
| 0.9 | Runs Ratio | 0.7 |
| 0.7 | Patience Ratio | 0.3 |
| 0.5 | Balls In Play Average | 0.3 |
| 112.5 | MLB Rating | 77.0 |
| 0.0 | Offensive Wins Above Replacement | 0.0 |
| 0.0 | Wins Above Replacement | 0.0 |
Game Information

Location: St. Louis, Missouri
Attendance: 27,966 | Capacity:
2025 National League East Standings
| TEAM | W | L | PCT | GB | STRK |
|---|---|---|---|---|---|
 New York New York |
22 | 11 | .667 | - | W1 |
 Philadelphia Philadelphia |
18 | 14 | .563 | 3.5 | W1 |
 Atlanta Atlanta |
14 | 17 | .452 | 7 | L2 |
 Washington Washington |
14 | 19 | .424 | 8 | L1 |
 Miami Miami |
12 | 19 | .387 | 9 | L6 |
2025 National League Central Standings
| TEAM | W | L | PCT | GB | STRK |
|---|---|---|---|---|---|
 Chicago Chicago |
20 | 13 | .606 | - | W2 |
 Cincinnati Cincinnati |
18 | 15 | .545 | 2 | W2 |
 Milwaukee Milwaukee |
16 | 17 | .485 | 4 | L2 |
 St. Louis St. Louis |
14 | 19 | .424 | 6 | L2 |
 Pittsburgh Pittsburgh |
12 | 21 | .364 | 8 | L2 |