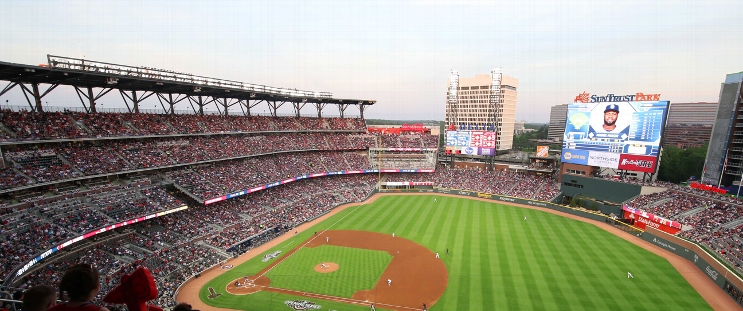
Los Angeles Dodgers at Atlanta Braves
· Major League Baseball
10 - 3

Ohtani and Freeman homer, Sasaki earns 1st MLB win as streaking Dodgers overpower Braves 10-3

The Dodgers have won the first two games of the series to improve to 5-0 against Atlanta this year. Los Angeles' three-game sweep at home early in the season left the Braves 0-7.
Sasaki (1-1) allowed three runs and six hits over five innings in a game pushed back more than three hours because of rain. The 23-year-old right-hander gave up a home run to Ozzie Albies but received plenty of offensive support in his seventh big league start since arriving from Japan to much fanfare.
The Dodgers piled up 12 hits and pulled away with a four-run fourth. Freeman hit a three-run homer off Scott Blewett in the eighth.
Atlanta starter Spencer Schwellenbach (1-3) lasted only 3 2/3 innings. He gave up six runs, five earned, and eight hits.
Ohtani hasn’t pitched in a major league game since Aug. 23, 2023, for the Los Angeles Angels.
How can I watch Los Angeles Dodgers vs. Atlanta Braves?
- TV Channel: Dodgers at Braves 2022 MLB Baseball, is broadcasted on FOX.
- Online streaming: Sign up for Fubo.
Scoring Summary
 |
9th Inning | Murphy struck out looking. |
 |
9th Inning | Olson struck out swinging. |
 |
9th Inning | Ozuna walked, Riley to second, Verdugo to third. |
 |
9th Inning | Riley singled to left, Verdugo to second. |
 |
9th Inning | Verdugo singled to center. |
 |
9th Inning | Allen struck out swinging. |
Statistics
 LAD LAD |
 ATL ATL |
|
|---|---|---|
| 1 | Games Played | 1 |
| 1 | Team Games Played | 1 |
| 1 | Hit By Pitch | 1 |
| 13 | Ground Balls | 8 |
| 12 | Strikeouts | 9 |
| 9 | Runs Batted In | 3 |
| 0 | Sacrifice Hit | 0 |
| 12 | Hits | 10 |
| 0 | Stolen Bases | 1 |
| 4 | Walks | 3 |
| 0 | Catcher Interference | 0 |
| 10 | Runs | 3 |
| 0 | Ground Into Double Play | 0 |
| 0 | Sacrifice Flies | 0 |
| 39 | At Bats | 37 |
| 2 | Home Runs | 1 |
| 0 | Grand Slam Home Runs | 0 |
| 15 | Runners Left On Base | 19 |
| 0 | Triples | 1 |
| 1 | Game Winning RBIs | 0 |
| 0 | Intentional Walks | 0 |
| 2 | Doubles | 2 |
| 14 | Fly Balls | 20 |
| 0 | Caught Stealing | 0 |
| 188 | Pitches | 170 |
| 0 | Games Started | 0 |
| 0 | Pinch At Bats | 0 |
| 0 | Pinch Hits | 0 |
| 0.0 | Player Rating | 0.0 |
| 1 | Is Qualified | 1 |
| 0 | Is Qualified In Steals | 1 |
| 20 | Total Bases | 17 |
| 44 | Plate Appearances | 41 |
| 324.0 | Projected Home Runs | 162.0 |
| 4 | Extra Base Hits | 4 |
| 7.7 | Runs Created | 6.2 |
| .308 | Batting Average | .270 |
| .000 | Pinch Hit Average | .000 |
| .513 | Slugging Percentage | .459 |
| .308 | Secondary Average | .297 |
| .386 | On Base Percentage | .341 |
| .899 | OBP Pct + SLG Pct | .801 |
| 0.9 | Ground To Fly Ball Ratio | 0.4 |
| 7.7 | Runs Created Per 27 Outs | 6.2 |
| 60.0 | Batter Rating | 32.5 |
| 19.5 | At Bats Per Home Run | 37.0 |
| 0.00 | Stolen Base Percentage | 1.00 |
| 4.27 | Pitches Per Plate Appearance | 4.15 |
| .205 | Isolated Power | .189 |
| 0.33 | Walk To Strikeout Ratio | 0.33 |
| .091 | Walks Per Plate Appearance | .073 |
| .000 | Secondary Average Minus Batting Average | .027 |
| 19.0 | Runs Produced | 6.0 |
| 0.9 | Runs Ratio | 1.0 |
| 0.6 | Patience Ratio | 0.5 |
| 0.4 | Balls In Play Average | 0.3 |
| 101.5 | MLB Rating | 84.3 |
| 0.0 | Offensive Wins Above Replacement | 0.0 |
| 0.0 | Wins Above Replacement | 0.0 |
Game Information

Location: Atlanta, Georgia
Attendance: 42,159 | Capacity:
2025 National League West Standings
| TEAM | W | L | PCT | GB | STRK |
|---|---|---|---|---|---|
 Los Angeles Los Angeles |
24 | 12 | .667 | - | L1 |
 San Diego San Diego |
23 | 12 | .657 | 0.5 | L1 |
 San Francisco San Francisco |
23 | 14 | .622 | 1.5 | W1 |
 Arizona Arizona |
19 | 17 | .528 | 5 | W1 |
 Colorado Colorado |
6 | 28 | .176 | 17 | L3 |
2025 National League East Standings
| TEAM | W | L | PCT | GB | STRK |
|---|---|---|---|---|---|
 New York New York |
23 | 14 | .622 | - | L1 |
 Philadelphia Philadelphia |
20 | 15 | .571 | 2 | W1 |
 Atlanta Atlanta |
17 | 18 | .486 | 5 | W3 |
 Washington Washington |
17 | 21 | .447 | 6.5 | L2 |
 Miami Miami |
14 | 21 | .400 | 8 | W1 |