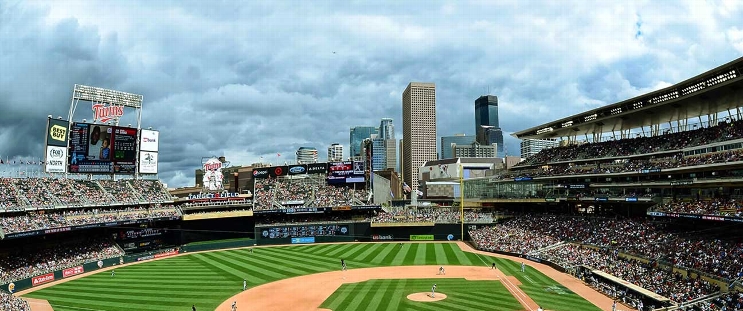
Baltimore Orioles at Minnesota Twins
· Major League Baseball
1 - 9

López fans 11 as Correa, Buxton homer in Twins' 9-1 win over Orioles

Byron Buxton also hit a three-run homer in the seventh and drove in four runs for the Twins, who have won three straight.
Baltimore had just three singles in losing their third in a row.
López (3-2), who had 10 or more strikeouts for the 10th time in his career, fanned the side in the first, third and fifth innings. He struck out Dylan Carlson looking to end the fifth, the final batter he faced. The right-hander allowed one run to lower his ERA to 2.18.
Correa’s homer was just his second of the season. The veteran shortstop entered Tuesday’s game batting .216 with a .560 OPS before delivering a 458-foot blast off Orioles starter Cade Povich (1-3).
Minnesota got Royce Lewis (left hamstring strain) and Willi Castro (right oblique) back from the injured list for the game. Lewis was the designated hitter and went 0 for 4 in his season debut. Castro played left field and was 1 for 3 with a walk.
This story has been updated to correct that Pablo López struck out 11 batters, not 10.
How can I watch Baltimore Orioles vs. Minnesota Twins?
- TV Channel: Orioles at Twins 2022 MLB Baseball, is broadcasted on MLB.TV.
- Online streaming: Sign up for Fubo.
Scoring Summary
 |
9th Inning | Holliday flied out to left. |
 |
9th Inning | Mountcastle struck out looking. |
 |
9th Inning | O'Hearn walked, Rutschman to second. |
 |
9th Inning | Rutschman walked. |
 |
9th Inning | Henderson grounded out to first. |
 |
9th Inning | Alcala relieved Sands |
Statistics
 BAL BAL |
 MIN MIN |
|
|---|---|---|
| 1 | Games Played | 1 |
| 1 | Team Games Played | 1 |
| 0 | Hit By Pitch | 0 |
| 10 | Ground Balls | 12 |
| 17 | Strikeouts | 7 |
| 1 | Runs Batted In | 9 |
| 0 | Sacrifice Hit | 0 |
| 3 | Hits | 10 |
| 0 | Stolen Bases | 0 |
| 3 | Walks | 1 |
| 0 | Catcher Interference | 0 |
| 1 | Runs | 9 |
| 0 | Ground Into Double Play | 1 |
| 0 | Sacrifice Flies | 0 |
| 30 | At Bats | 35 |
| 0 | Home Runs | 2 |
| 0 | Grand Slam Home Runs | 0 |
| 11 | Runners Left On Base | 7 |
| 0 | Triples | 0 |
| 0 | Game Winning RBIs | 1 |
| 0 | Intentional Walks | 0 |
| 1 | Doubles | 2 |
| 3 | Fly Balls | 16 |
| 0 | Caught Stealing | 0 |
| 151 | Pitches | 151 |
| 0 | Games Started | 0 |
| 0 | Pinch At Bats | 0 |
| 0 | Pinch Hits | 0 |
| 0.0 | Player Rating | 0.0 |
| 1 | Is Qualified | 1 |
| 0 | Is Qualified In Steals | 0 |
| 4 | Total Bases | 18 |
| 33 | Plate Appearances | 36 |
| 0.0 | Projected Home Runs | 324.0 |
| 1 | Extra Base Hits | 4 |
| -0.1 | Runs Created | 5.1 |
| .100 | Batting Average | .286 |
| .000 | Pinch Hit Average | .000 |
| .133 | Slugging Percentage | .514 |
| .133 | Secondary Average | .257 |
| .182 | On Base Percentage | .306 |
| .315 | OBP Pct + SLG Pct | .820 |
| 3.3 | Ground To Fly Ball Ratio | 0.8 |
| -0.1 | Runs Created Per 27 Outs | 5.3 |
| 9.0 | Batter Rating | 56.0 |
| 0.0 | At Bats Per Home Run | 17.5 |
| 0.00 | Stolen Base Percentage | 0.00 |
| 4.58 | Pitches Per Plate Appearance | 4.19 |
| .033 | Isolated Power | .229 |
| 0.18 | Walk To Strikeout Ratio | 0.14 |
| .091 | Walks Per Plate Appearance | .028 |
| .033 | Secondary Average Minus Batting Average | -.029 |
| 2.0 | Runs Produced | 18.0 |
| 1.0 | Runs Ratio | 1.0 |
| 0.2 | Patience Ratio | 0.5 |
| 0.2 | Balls In Play Average | 0.3 |
| 57.8 | MLB Rating | 97.3 |
| 0.0 | Offensive Wins Above Replacement | 0.0 |
| 0.0 | Wins Above Replacement | 0.0 |
Game Information

Location: Minneapolis, Minnesota
Attendance: 19,779 | Capacity:
2025 American League East Standings
| TEAM | W | L | PCT | GB | STRK |
|---|---|---|---|---|---|
 New York New York |
20 | 16 | .556 | - | W1 |
 Boston Boston |
18 | 19 | .486 | 2.5 | L3 |
 Tampa Bay Tampa Bay |
16 | 19 | .457 | 3.5 | L1 |
 Toronto Toronto |
16 | 19 | .457 | 3.5 | L3 |
 Baltimore Baltimore |
13 | 21 | .382 | 6 | L3 |
2025 American League Central Standings
| TEAM | W | L | PCT | GB | STRK |
|---|---|---|---|---|---|
 Detroit Detroit |
22 | 13 | .629 | - | W1 |
 Cleveland Cleveland |
22 | 15 | .595 | 1 | W2 |
 Kansas City Kansas City |
21 | 16 | .568 | 2 | W4 |
 Minnesota Minnesota |
16 | 20 | .444 | 6.5 | W3 |
 Chicago Chicago |
10 | 26 | .278 | 12.5 | L2 |