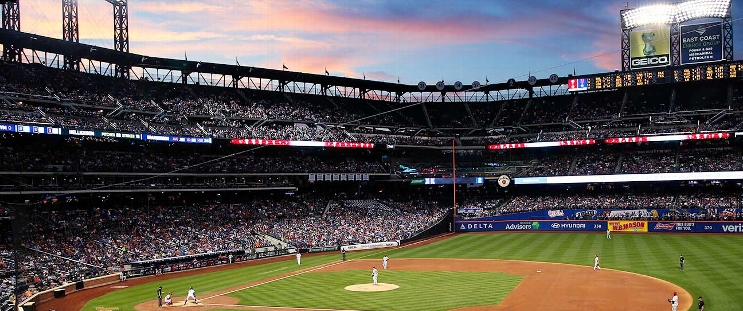
Chicago Cubs at New York Mets
· Major League Baseball
2 - 7

Lindor hits another leadoff homer, Mets beat Cubs 7-2

Brett Baty and Jeff McNeil went deep in the second while Juan Soto homered in the fourth to help the Mets improve to 14-3 at Citi Field. Soto added an RBI single in the eighth.
Every starter had at least one hit for the Mets, who scored twice in the third when Brandon Nimmo and Francisco Alvarez came home after Dansby Swanson overthrew first base trying to double up the speedy Luisangel Acuña.
Clay Holmes (5-1), pitching the same night the first 15,000 fans received Holmes hockey jerseys, allowed three hits in six solid innings as he lowered his ERA to 2.74 over eight starts.
Kyle Tucker’s homer leading off the fourth was the first round-tripper surrendered this season by Holmes. The last Mets newcomer to go longer without allowing a homer was Orel Hershiser, who didn’t give up a homer in his first eight starts in 1999.
Michael Busch homered in the ninth.
Jameson Taillon (2-1) gave up six runs (five earned) on nine hits while throwing a season-high 100 pitches in a season-low four innings.
How can I watch Chicago Cubs vs. New York Mets?
- TV Channel: Cubs at Mets 2022 MLB Baseball, is broadcasted on MLB.TV.
- Online streaming: Sign up for Fubo.
Scoring Summary
 |
9th Inning | Swanson struck out swinging. |
 |
9th Inning | Crow-Armstrong to second on wild pitch by Buttó. |
 |
9th Inning | Hoerner struck out swinging. |
 |
9th Inning | Crow-Armstrong singled to right. |
 |
9th Inning | Bruján struck out swinging. |
 |
9th Inning | Bruján hit for Kelly |
Statistics
 CHC CHC |
 NYM NYM |
|
|---|---|---|
| 1 | Games Played | 1 |
| 1 | Team Games Played | 1 |
| 0 | Hit By Pitch | 0 |
| 11 | Ground Balls | 17 |
| 11 | Strikeouts | 8 |
| 2 | Runs Batted In | 6 |
| 0 | Sacrifice Hit | 0 |
| 5 | Hits | 13 |
| 0 | Stolen Bases | 3 |
| 5 | Walks | 2 |
| 0 | Catcher Interference | 0 |
| 2 | Runs | 7 |
| 1 | Ground Into Double Play | 0 |
| 0 | Sacrifice Flies | 0 |
| 30 | At Bats | 37 |
| 2 | Home Runs | 4 |
| 0 | Grand Slam Home Runs | 0 |
| 12 | Runners Left On Base | 12 |
| 0 | Triples | 0 |
| 0 | Game Winning RBIs | 1 |
| 0 | Intentional Walks | 0 |
| 1 | Doubles | 1 |
| 8 | Fly Balls | 12 |
| 1 | Caught Stealing | 0 |
| 152 | Pitches | 169 |
| 0 | Games Started | 0 |
| 1 | Pinch At Bats | 1 |
| 0 | Pinch Hits | 0 |
| 0.0 | Player Rating | 0.0 |
| 1 | Is Qualified | 1 |
| 1 | Is Qualified In Steals | 1 |
| 12 | Total Bases | 26 |
| 35 | Plate Appearances | 39 |
| 324.0 | Projected Home Runs | 648.0 |
| 3 | Extra Base Hits | 5 |
| 3.0 | Runs Created | 9.8 |
| .167 | Batting Average | .351 |
| .000 | Pinch Hit Average | .000 |
| .400 | Slugging Percentage | .703 |
| .367 | Secondary Average | .486 |
| .286 | On Base Percentage | .385 |
| .686 | OBP Pct + SLG Pct | 1.087 |
| 1.4 | Ground To Fly Ball Ratio | 1.4 |
| 3.0 | Runs Created Per 27 Outs | 11.1 |
| 21.0 | Batter Rating | 56.0 |
| 15.0 | At Bats Per Home Run | 9.3 |
| 0.00 | Stolen Base Percentage | 1.00 |
| 4.34 | Pitches Per Plate Appearance | 4.33 |
| .233 | Isolated Power | .351 |
| 0.45 | Walk To Strikeout Ratio | 0.25 |
| .143 | Walks Per Plate Appearance | .051 |
| .200 | Secondary Average Minus Batting Average | .135 |
| 4.0 | Runs Produced | 13.0 |
| 1.0 | Runs Ratio | 0.9 |
| 0.5 | Patience Ratio | 0.7 |
| 0.2 | Balls In Play Average | 0.4 |
| 72.0 | MLB Rating | 104.3 |
| 0.0 | Offensive Wins Above Replacement | 0.0 |
| 0.0 | Wins Above Replacement | 0.0 |
Game Information

Location: Queens, New York
Attendance: 41,243 | Capacity:
2025 National League Central Standings
| TEAM | W | L | PCT | GB | STRK |
|---|---|---|---|---|---|
 Milwaukee Milwaukee |
97 | 65 | .599 | - | W1 |
 Chicago Chicago |
92 | 70 | .568 | 5 | W3 |
 Cincinnati Cincinnati |
83 | 79 | .512 | 14 | L1 |
 St. Louis St. Louis |
78 | 84 | .481 | 19 | L4 |
 Pittsburgh Pittsburgh |
71 | 91 | .438 | 26 | L1 |
2025 National League East Standings
| TEAM | W | L | PCT | GB | STRK |
|---|---|---|---|---|---|
 Philadelphia Philadelphia |
96 | 66 | .593 | - | W1 |
 New York New York |
83 | 79 | .512 | 13 | L1 |
 Miami Miami |
79 | 83 | .488 | 17 | W1 |
 Atlanta Atlanta |
76 | 86 | .469 | 20 | W1 |
 Washington Washington |
66 | 96 | .407 | 30 | L1 |