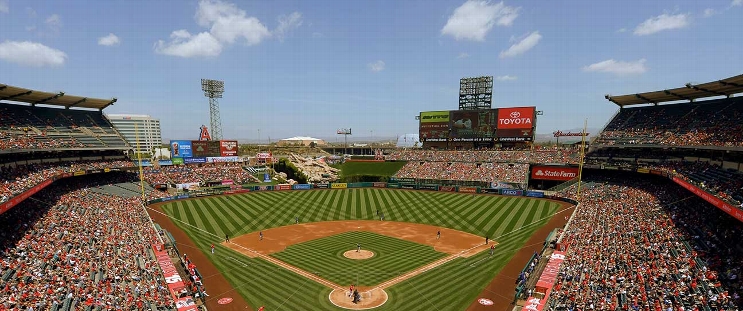
Baltimore Orioles at Los Angeles Angels
· Major League Baseball
2 - 5

Matthew Lugo's RBI triple for his first major league hit propels Angels past Orioles, 5-2

Jack Kochanowicz (2-5) ended his five-start losing streak for the Angels, yielding one run on four hits and four walks while pitching into the sixth inning in this meeting of last-place clubs.
Ramón Laureano homered and Ryan Mountcastle had an RBI double for the Orioles, who have lost six of seven. Baltimore was held to six hits by five Angels pitchers.
Lugo, who made his MLB debut as a pinch-runner Friday, went 1 for 4 in his first career start. Carlos Beltrán’s nephew, a former second-round pick by Boston, is the third of four prospects acquired last year for reliever Luis García to play for the Angels.
Kyle Gibson (0-2) allowed five runs on seven hits and three walks in his third start in Baltimore’s injury-plagued rotation. The veteran has yet to record an out in the fifth inning for the Orioles.
The Angels got three singles on Gibson's first seven pitches and scored twice in the first.
Luis Rengifo had a bases-loaded RBI groundout in the fifth while the Angels chased Gibson.
Gunnar Henderson singled and scored Baltimore's first run on Mountcastle's two-out double in the sixth.
How can I watch Baltimore Orioles vs. Los Angeles Angels?
- TV Channel: Orioles at Angels 2022 MLB Baseball, is broadcasted on MLB.TV.
- Online streaming: Sign up for Fubo.
Scoring Summary
 |
9th Inning | Rivera flied out to right. |
 |
9th Inning | O'Neill flied out to right. |
 |
9th Inning | O'Neill hit for Kjerstad |
 |
9th Inning | Mullins grounded out to pitcher. |
 |
9th Inning | Laureano homered to right center (382 feet). |
 |
9th Inning | Burke relieved Zeferjahn |
Statistics
 BAL BAL |
 LAA LAA |
|
|---|---|---|
| 1 | Games Played | 1 |
| 1 | Team Games Played | 1 |
| 0 | Hit By Pitch | 0 |
| 15 | Ground Balls | 11 |
| 7 | Strikeouts | 8 |
| 2 | Runs Batted In | 5 |
| 0 | Sacrifice Hit | 0 |
| 6 | Hits | 7 |
| 0 | Stolen Bases | 0 |
| 4 | Walks | 6 |
| 0 | Catcher Interference | 0 |
| 2 | Runs | 5 |
| 2 | Ground Into Double Play | 0 |
| 0 | Sacrifice Flies | 1 |
| 31 | At Bats | 30 |
| 1 | Home Runs | 1 |
| 0 | Grand Slam Home Runs | 0 |
| 9 | Runners Left On Base | 14 |
| 0 | Triples | 1 |
| 0 | Game Winning RBIs | 1 |
| 0 | Intentional Walks | 0 |
| 1 | Doubles | 0 |
| 9 | Fly Balls | 12 |
| 0 | Caught Stealing | 0 |
| 147 | Pitches | 148 |
| 0 | Games Started | 0 |
| 2 | Pinch At Bats | 0 |
| 1 | Pinch Hits | 0 |
| 0.0 | Player Rating | 0.0 |
| 1 | Is Qualified | 1 |
| 0 | Is Qualified In Steals | 0 |
| 10 | Total Bases | 12 |
| 35 | Plate Appearances | 37 |
| 162.0 | Projected Home Runs | 162.0 |
| 2 | Extra Base Hits | 2 |
| 2.3 | Runs Created | 4.9 |
| .194 | Batting Average | .233 |
| .500 | Pinch Hit Average | .000 |
| .323 | Slugging Percentage | .400 |
| .258 | Secondary Average | .367 |
| .286 | On Base Percentage | .351 |
| .608 | OBP Pct + SLG Pct | .751 |
| 1.7 | Ground To Fly Ball Ratio | 0.9 |
| 2.3 | Runs Created Per 27 Outs | 5.5 |
| 19.0 | Batter Rating | 32.5 |
| 31.0 | At Bats Per Home Run | 30.0 |
| 0.00 | Stolen Base Percentage | 0.00 |
| 4.20 | Pitches Per Plate Appearance | 4.00 |
| .129 | Isolated Power | .167 |
| 0.57 | Walk To Strikeout Ratio | 0.75 |
| .114 | Walks Per Plate Appearance | .162 |
| .065 | Secondary Average Minus Batting Average | .133 |
| 4.0 | Runs Produced | 10.0 |
| 1.0 | Runs Ratio | 1.0 |
| 0.4 | Patience Ratio | 0.5 |
| 0.2 | Balls In Play Average | 0.3 |
| 72.0 | MLB Rating | 82.0 |
| 0.0 | Offensive Wins Above Replacement | 0.0 |
| 0.0 | Wins Above Replacement | 0.0 |
Game Information

Location: Anaheim, California
Attendance: 27,975 | Capacity:
2025 American League East Standings
| TEAM | W | L | PCT | GB | STRK |
|---|---|---|---|---|---|
 Toronto Toronto |
94 | 68 | .580 | - | W4 |
 New York New York |
94 | 68 | .580 | - | W8 |
 Boston Boston |
89 | 73 | .549 | 5 | W1 |
 Tampa Bay Tampa Bay |
77 | 85 | .475 | 17 | L4 |
 Baltimore Baltimore |
75 | 87 | .463 | 19 | L3 |
2025 American League West Standings
| TEAM | W | L | PCT | GB | STRK |
|---|---|---|---|---|---|
 Seattle Seattle |
90 | 72 | .556 | - | L3 |
 Houston Houston |
87 | 75 | .537 | 3 | W2 |
 Texas Texas |
81 | 81 | .500 | 9 | L2 |
 Athletics Athletics |
76 | 86 | .469 | 14 | L2 |
 Los Angeles Los Angeles |
72 | 90 | .444 | 18 | L2 |