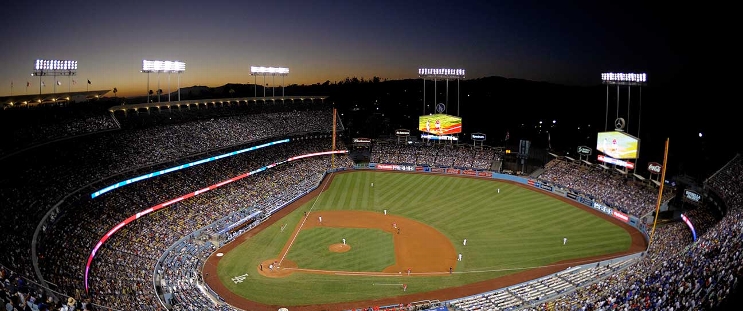
Athletics at Los Angeles Dodgers
· Major League Baseball
3 - 9

Dodgers get homers from Ohtani, Pages, Kim and Muncy and rally past the Athletics 9-3

Shohei Ohtani hit a 403-foot leadoff homer in the first and Andy Pages followed with a 417-foot shot on his first pitch in the second, giving the Dodgers a 2-0 lead.
The Athletics tied it in the third on Tyler Soderstrom's two-run homer on the first pitch from Yoshinobu Yamamoto (5-3). They went ahead 3-2 in the fourth on Miguel Andujar's RBI double to left.
Yamamoto allowed three runs and four hits in six innings. He struck out six.
The Dodgers tied it on Hyeseong Kim's homer leading off the fifth, one of three homers given up by A's starter Gunnar Hoglund (1-1). He allowed four runs and seven hits in 5 1/3 innings and struck out five.
In the sixth, Pages drew a leadoff walk and was thrown out at third on Michael Conforto's single to left. Hogan Harris came in and gave up Rojas' double to center.
The Dodgers tacked on five runs in the eighth, highlighted by Max Muncy's three-run blast.
How can I watch Athletics vs. Los Angeles Dodgers?
- TV Channel: Athletics at Dodgers 2022 MLB Baseball, is broadcasted on MLB.TV.
- Online streaming: Sign up for Fubo.
Scoring Summary
 |
9th Inning | Bleday flied out to left. |
 |
9th Inning | Andujar grounded out to third. |
 |
9th Inning | Butler grounded out to second. |
 |
9th Inning | Casparius relieved Yates |
 |
8th Inning | Pages struck out swinging. |
 |
8th Inning | Muncy homered to right (396 feet), Betts scored and Freeman scored. |
Statistics
 ATH ATH |
 LAD LAD |
|
|---|---|---|
| 1 | Games Played | 1 |
| 1 | Team Games Played | 1 |
| 0 | Hit By Pitch | 0 |
| 13 | Ground Balls | 11 |
| 8 | Strikeouts | 7 |
| 3 | Runs Batted In | 9 |
| 0 | Sacrifice Hit | 1 |
| 5 | Hits | 13 |
| 1 | Stolen Bases | 0 |
| 2 | Walks | 6 |
| 0 | Catcher Interference | 0 |
| 3 | Runs | 9 |
| 0 | Ground Into Double Play | 0 |
| 0 | Sacrifice Flies | 0 |
| 32 | At Bats | 35 |
| 1 | Home Runs | 4 |
| 0 | Grand Slam Home Runs | 0 |
| 13 | Runners Left On Base | 14 |
| 0 | Triples | 0 |
| 0 | Game Winning RBIs | 1 |
| 0 | Intentional Walks | 1 |
| 2 | Doubles | 2 |
| 11 | Fly Balls | 18 |
| 0 | Caught Stealing | 0 |
| 126 | Pitches | 157 |
| 0 | Games Started | 0 |
| 0 | Pinch At Bats | 2 |
| 0 | Pinch Hits | 1 |
| 0.0 | Player Rating | 0.0 |
| 1 | Is Qualified | 1 |
| 1 | Is Qualified In Steals | 0 |
| 10 | Total Bases | 27 |
| 34 | Plate Appearances | 42 |
| 162.0 | Projected Home Runs | 648.0 |
| 3 | Extra Base Hits | 6 |
| 2.1 | Runs Created | 11.3 |
| .156 | Batting Average | .371 |
| .000 | Pinch Hit Average | .500 |
| .313 | Slugging Percentage | .771 |
| .250 | Secondary Average | .571 |
| .206 | On Base Percentage | .463 |
| .518 | OBP Pct + SLG Pct | 1.235 |
| 1.2 | Ground To Fly Ball Ratio | 0.6 |
| 2.1 | Runs Created Per 27 Outs | 13.2 |
| 25.0 | Batter Rating | 65.0 |
| 32.0 | At Bats Per Home Run | 8.8 |
| 1.00 | Stolen Base Percentage | 0.00 |
| 3.71 | Pitches Per Plate Appearance | 3.74 |
| .156 | Isolated Power | .400 |
| 0.25 | Walk To Strikeout Ratio | 0.86 |
| .059 | Walks Per Plate Appearance | .143 |
| .094 | Secondary Average Minus Batting Average | .200 |
| 6.0 | Runs Produced | 18.0 |
| 1.0 | Runs Ratio | 1.0 |
| 0.4 | Patience Ratio | 0.9 |
| 0.2 | Balls In Play Average | 0.4 |
| 72.0 | MLB Rating | 111.5 |
| 0.0 | Offensive Wins Above Replacement | 0.0 |
| 0.0 | Wins Above Replacement | 0.0 |
Game Information

Location: Los Angeles, California
Attendance: 50,071 | Capacity:
2025 American League West Standings
| TEAM | W | L | PCT | GB | STRK |
|---|---|---|---|---|---|
 Seattle Seattle |
90 | 72 | .556 | - | L3 |
 Houston Houston |
87 | 75 | .537 | 3 | W2 |
 Texas Texas |
81 | 81 | .500 | 9 | L2 |
 Athletics Athletics |
76 | 86 | .469 | 14 | L2 |
 Los Angeles Los Angeles |
72 | 90 | .444 | 18 | L2 |
2025 National League West Standings
| TEAM | W | L | PCT | GB | STRK |
|---|---|---|---|---|---|
 Los Angeles Los Angeles |
93 | 69 | .574 | - | W5 |
 San Diego San Diego |
90 | 72 | .556 | 3 | W3 |
 San Francisco San Francisco |
81 | 81 | .500 | 12 | W4 |
 Arizona Arizona |
80 | 82 | .494 | 13 | L5 |
 Colorado Colorado |
43 | 119 | .265 | 50 | L6 |