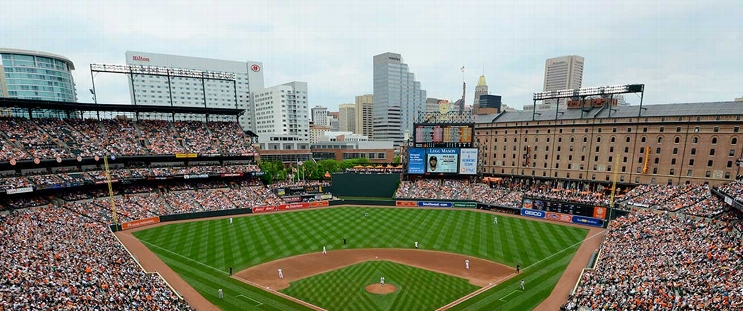
Minnesota Twins at Baltimore Orioles
· Major League Baseball
4 - 0

Twins extend winning streak to 11 games with 4-0 victory over Orioles

The win streak is the fourth-longest in Twins history. The record is 15 straight in 1991. They had a 12-game winning streak last season. The Twins swept the season series 6-0 after being swept by the Orioles 6-0 last year.
After the homers gave the Twins a 3-0 lead in the top of the third, center fielder Carlos Correa collided while chasing a shallow fly ball that Buxton caught. Correa left the game while Buxton stayed in before exiting in the fourth. The team said both were in concussion protocol.
Paddack gave up three hits and one walk. He struck out three. Louis Varland and Jhoan Duran finished up the Twins' third shutout this season.
Since giving up nine runs in his season opener, Paddack has posted a 2.51 ERA over eight starts and pitched seven or more innings in consecutive starts for the first time in his seven-year MLB career.
Willi Castro and Royce Lewis had two hits each with Lewis reaching 500 for his career.
Tomoyuki Sugano (4-3) went 6 1/3 innings, giving up four runs on six hits and a walk while striking out three.
Ryan O'Hearn had two hits for the Orioles.
How can I watch Minnesota Twins vs. Baltimore Orioles?
- TV Channel: Twins at Orioles 2022 MLB Baseball, is broadcasted on MLB.TV.
- Online streaming: Sign up for Fubo.
Scoring Summary
 |
9th Inning | O'Neill struck out looking. |
 |
9th Inning | O'Hearn reached on infield single to third, Rutschman to second. |
 |
9th Inning | Rutschman singled to left. |
 |
9th Inning | Henderson grounded out to second. |
 |
9th Inning | Mountcastle flied out to right. |
 |
9th Inning | Clemens at second base. |
Statistics
 MIN MIN |
 BAL BAL |
|
|---|---|---|
| 1 | Games Played | 1 |
| 1 | Team Games Played | 1 |
| 0 | Hit By Pitch | 2 |
| 12 | Ground Balls | 12 |
| 7 | Strikeouts | 6 |
| 4 | Runs Batted In | 0 |
| 0 | Sacrifice Hit | 0 |
| 7 | Hits | 6 |
| 0 | Stolen Bases | 0 |
| 3 | Walks | 1 |
| 0 | Catcher Interference | 0 |
| 4 | Runs | 0 |
| 1 | Ground Into Double Play | 2 |
| 0 | Sacrifice Flies | 0 |
| 33 | At Bats | 30 |
| 2 | Home Runs | 0 |
| 0 | Grand Slam Home Runs | 0 |
| 15 | Runners Left On Base | 13 |
| 0 | Triples | 0 |
| 1 | Game Winning RBIs | 0 |
| 0 | Intentional Walks | 0 |
| 2 | Doubles | 2 |
| 14 | Fly Balls | 12 |
| 0 | Caught Stealing | 0 |
| 156 | Pitches | 133 |
| 0 | Games Started | 0 |
| 0 | Pinch At Bats | 0 |
| 0 | Pinch Hits | 0 |
| 0.0 | Player Rating | 0.0 |
| 1 | Is Qualified | 1 |
| 0 | Is Qualified In Steals | 0 |
| 15 | Total Bases | 8 |
| 36 | Plate Appearances | 33 |
| 324.0 | Projected Home Runs | 0.0 |
| 4 | Extra Base Hits | 2 |
| 4.0 | Runs Created | 1.5 |
| .212 | Batting Average | .200 |
| .000 | Pinch Hit Average | .000 |
| .455 | Slugging Percentage | .267 |
| .333 | Secondary Average | .100 |
| .278 | On Base Percentage | .273 |
| .732 | OBP Pct + SLG Pct | .539 |
| 0.9 | Ground To Fly Ball Ratio | 1.0 |
| 4.0 | Runs Created Per 27 Outs | 1.6 |
| 33.0 | Batter Rating | 10.0 |
| 16.5 | At Bats Per Home Run | 0.0 |
| 0.00 | Stolen Base Percentage | 0.00 |
| 4.33 | Pitches Per Plate Appearance | 4.03 |
| .242 | Isolated Power | .067 |
| 0.43 | Walk To Strikeout Ratio | 0.17 |
| .083 | Walks Per Plate Appearance | .030 |
| .121 | Secondary Average Minus Batting Average | -.100 |
| 8.0 | Runs Produced | 0.0 |
| 1.0 | Runs Ratio | 0.0 |
| 0.5 | Patience Ratio | 0.3 |
| 0.2 | Balls In Play Average | 0.3 |
| 81.5 | MLB Rating | 66.3 |
| 0.0 | Offensive Wins Above Replacement | 0.0 |
| 0.0 | Wins Above Replacement | 0.0 |
Game Information

Location: Baltimore, Maryland
Attendance: 30,926 | Capacity:
2025 American League Central Standings
| TEAM | W | L | PCT | GB | STRK |
|---|---|---|---|---|---|
 Cleveland Cleveland |
88 | 74 | .543 | - | W2 |
 Detroit Detroit |
87 | 75 | .537 | 1 | L1 |
 Kansas City Kansas City |
82 | 80 | .506 | 6 | W2 |
 Minnesota Minnesota |
70 | 92 | .432 | 18 | L1 |
 Chicago Chicago |
60 | 102 | .370 | 28 | W1 |
2025 American League East Standings
| TEAM | W | L | PCT | GB | STRK |
|---|---|---|---|---|---|
 Toronto Toronto |
94 | 68 | .580 | - | W4 |
 New York New York |
94 | 68 | .580 | - | W8 |
 Boston Boston |
89 | 73 | .549 | 5 | W1 |
 Tampa Bay Tampa Bay |
77 | 85 | .475 | 17 | L4 |
 Baltimore Baltimore |
75 | 87 | .463 | 19 | L3 |