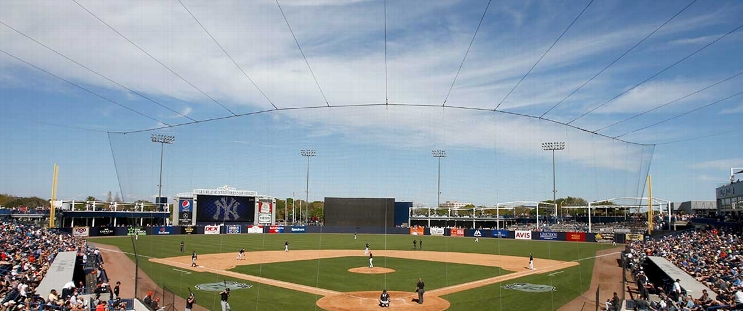
Houston Astros at Tampa Bay Rays
· Major League Baseball
4 - 3

Jake Meyers hits go-ahead HR, Josh Hader gets 12th save as Astros beat Rays 4-3

Chandler Simpson reached on catcher's interference to begin the ninth against Hader. Simpson advanced on a ground out before stealing third. Hader then got Taylor Wells to pop up a bunt and Isaac Paredes to pop out near third for his 12th save in 12 opportunities.
Meyers went 2 for 3 and hit his third home run on the second pitch from reliever Manuel Rodriguez (0-2) to put the Astros ahead in the seventh.
Meyers walked, stole his eighth base and scored on a double by Cam Smith as part of a three-run first inning against Rays starter Ryan Pepiot. Victor Caratini opened the scoring with his third home run — a two-out solo shot — and Chas McCormick capped it with an RBI single.
Houston's Colton Gordon — a native of St. Petersburg, Florida, making his second career start — allowed a single to Yandy Díaz leading off the first then retired 12 straight until Brandon Lowe singled in the fifth. Danny Jansen followed with his third homer to make it 3-2. Díaz and José Caballero had back-to-back doubles in the sixth to tie it.
Gordon allowed three runs and five hits in 5 1/3 innings with seven strikeouts. Bryan King (2-0) got four outs for the win.
Pepiot allowed three runs on eight hits in six innings.
How can I watch Houston Astros vs. Tampa Bay Rays?
- TV Channel: Astros at Rays 2022 MLB Baseball, is broadcasted on MLB.TV.
- Online streaming: Sign up for Fubo.
Scoring Summary
 |
9th Inning | Rortvedt fouled out to third. |
 |
9th Inning | Walls bunt popped out to second. |
 |
9th Inning | Simpson stole third. |
 |
9th Inning | Mead grounded out to third, Simpson to second. |
 |
9th Inning | Simpson reached first base on catcher's interference. |
 |
9th Inning | Hader relieved Abreu |
Statistics
 HOU HOU |
 TB TB |
|
|---|---|---|
| 1 | Games Played | 1 |
| 1 | Team Games Played | 1 |
| 1 | Hit By Pitch | 0 |
| 8 | Ground Balls | 12 |
| 3 | Strikeouts | 9 |
| 4 | Runs Batted In | 3 |
| 0 | Sacrifice Hit | 0 |
| 11 | Hits | 7 |
| 1 | Stolen Bases | 4 |
| 1 | Walks | 1 |
| 0 | Catcher Interference | 1 |
| 4 | Runs | 3 |
| 2 | Ground Into Double Play | 0 |
| 0 | Sacrifice Flies | 0 |
| 34 | At Bats | 34 |
| 2 | Home Runs | 1 |
| 0 | Grand Slam Home Runs | 0 |
| 14 | Runners Left On Base | 16 |
| 0 | Triples | 0 |
| 1 | Game Winning RBIs | 0 |
| 0 | Intentional Walks | 0 |
| 1 | Doubles | 2 |
| 23 | Fly Balls | 13 |
| 3 | Caught Stealing | 0 |
| 123 | Pitches | 141 |
| 0 | Games Started | 0 |
| 0 | Pinch At Bats | 2 |
| 0 | Pinch Hits | 0 |
| 0.0 | Player Rating | 0.0 |
| 1 | Is Qualified | 1 |
| 1 | Is Qualified In Steals | 1 |
| 18 | Total Bases | 12 |
| 36 | Plate Appearances | 36 |
| 324.0 | Projected Home Runs | 162.0 |
| 3 | Extra Base Hits | 3 |
| 4.6 | Runs Created | 3.4 |
| .324 | Batting Average | .206 |
| .000 | Pinch Hit Average | .000 |
| .529 | Slugging Percentage | .353 |
| .176 | Secondary Average | .294 |
| .361 | On Base Percentage | .229 |
| .891 | OBP Pct + SLG Pct | .582 |
| 0.3 | Ground To Fly Ball Ratio | 0.9 |
| 4.5 | Runs Created Per 27 Outs | 3.4 |
| 36.0 | Batter Rating | 30.0 |
| 17.0 | At Bats Per Home Run | 34.0 |
| 0.25 | Stolen Base Percentage | 1.00 |
| 3.42 | Pitches Per Plate Appearance | 3.92 |
| .206 | Isolated Power | .147 |
| 0.33 | Walk To Strikeout Ratio | 0.11 |
| .028 | Walks Per Plate Appearance | .028 |
| -.147 | Secondary Average Minus Batting Average | .088 |
| 8.0 | Runs Produced | 6.0 |
| 1.0 | Runs Ratio | 1.0 |
| 0.6 | Patience Ratio | 0.4 |
| 0.3 | Balls In Play Average | 0.3 |
| 89.5 | MLB Rating | 76.3 |
| 0.0 | Offensive Wins Above Replacement | 0.0 |
| 0.0 | Wins Above Replacement | 0.0 |
Game Information

Location: Tampa, Florida
Attendance: 10,046 | Capacity:
2025 American League West Standings
| TEAM | W | L | PCT | GB | STRK |
|---|---|---|---|---|---|
 Seattle Seattle |
90 | 72 | .556 | - | L3 |
 Houston Houston |
87 | 75 | .537 | 3 | W2 |
 Texas Texas |
81 | 81 | .500 | 9 | L2 |
 Athletics Athletics |
76 | 86 | .469 | 14 | L2 |
 Los Angeles Los Angeles |
72 | 90 | .444 | 18 | L2 |
2025 American League East Standings
| TEAM | W | L | PCT | GB | STRK |
|---|---|---|---|---|---|
 Toronto Toronto |
94 | 68 | .580 | - | W4 |
 New York New York |
94 | 68 | .580 | - | W8 |
 Boston Boston |
89 | 73 | .549 | 5 | W1 |
 Tampa Bay Tampa Bay |
77 | 85 | .475 | 17 | L4 |
 Baltimore Baltimore |
75 | 87 | .463 | 19 | L3 |