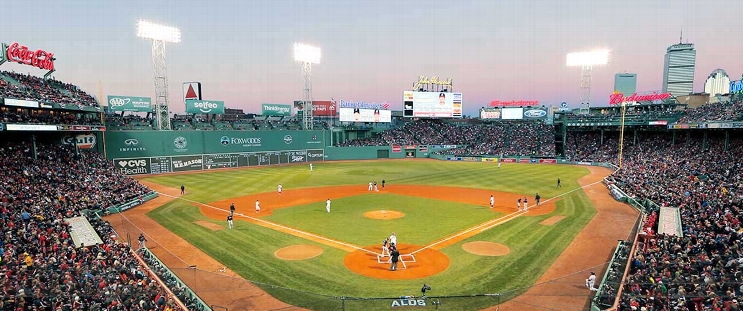
New York Mets at Boston Red Sox
· Major League Baseball
1 - 3

Jarren Duran has triple and double off Mets ace Kodai Senga to lead Red Sox to 3-1 victory

Senga (4-3) fell behind 3-0 after two innings before settling down and retiring the last seven batters he faced. He allowed five hits and three walks while striking out five.
New York dropped out of first place in the NL East for the first time since April 9.
Red Sox starter Hunter Dobbins held the Mets to one run and five hits, allowing back-to-back singles before throwing a called third strike past Tyrone Taylor for the second out in the fifth. Justin Wilson (2-0) fanned Francisco Lindor to end the threat.
Aroldis Chapman pitched the ninth for his seventh save.
Duran led off the first with a double, went to third on a wild pitch and scored on Alex Bregman’s groundout. Trevor Story singled in another run to make it 2-0.
Boston made it 3-0 in the second on Duran’s RBI triple, his sixth of the season.
The Mets’ only run came on Taylor’s RBI single in the third.
How can I watch New York Mets vs. Boston Red Sox?
- TV Channel: Mets at Red Sox 2022 MLB Baseball, is broadcasted on MLB.TV.
- Online streaming: Sign up for Fubo.
Scoring Summary
 |
9th Inning | Alvarez grounded into double play, second to shortstop to first, Marte out at second. |
 |
9th Inning | Marte singled to left. |
 |
9th Inning | Marte hit for Baty |
 |
9th Inning | Vientos struck out swinging. |
 |
9th Inning | Chapman relieved Slaten |
 |
8th Inning | Rafaela flied out to center. |
Statistics
 NYM NYM |
 BOS BOS |
|
|---|---|---|
| 1 | Games Played | 1 |
| 1 | Team Games Played | 1 |
| 0 | Hit By Pitch | 0 |
| 13 | Ground Balls | 18 |
| 7 | Strikeouts | 5 |
| 1 | Runs Batted In | 3 |
| 0 | Sacrifice Hit | 0 |
| 8 | Hits | 8 |
| 1 | Stolen Bases | 1 |
| 3 | Walks | 4 |
| 0 | Catcher Interference | 0 |
| 1 | Runs | 3 |
| 3 | Ground Into Double Play | 0 |
| 0 | Sacrifice Flies | 0 |
| 31 | At Bats | 32 |
| 0 | Home Runs | 0 |
| 0 | Grand Slam Home Runs | 0 |
| 13 | Runners Left On Base | 16 |
| 0 | Triples | 1 |
| 0 | Game Winning RBIs | 1 |
| 0 | Intentional Walks | 0 |
| 1 | Doubles | 4 |
| 11 | Fly Balls | 9 |
| 0 | Caught Stealing | 1 |
| 126 | Pitches | 135 |
| 0 | Games Started | 0 |
| 1 | Pinch At Bats | 0 |
| 1 | Pinch Hits | 0 |
| 0.0 | Player Rating | 0.0 |
| 1 | Is Qualified | 1 |
| 1 | Is Qualified In Steals | 1 |
| 9 | Total Bases | 14 |
| 34 | Plate Appearances | 36 |
| 0.0 | Projected Home Runs | 0.0 |
| 1 | Extra Base Hits | 5 |
| 2.3 | Runs Created | 4.7 |
| .258 | Batting Average | .250 |
| 1.000 | Pinch Hit Average | .000 |
| .290 | Slugging Percentage | .438 |
| .161 | Secondary Average | .313 |
| .324 | On Base Percentage | .333 |
| .614 | OBP Pct + SLG Pct | .771 |
| 1.2 | Ground To Fly Ball Ratio | 2.0 |
| 2.3 | Runs Created Per 27 Outs | 5.1 |
| 15.0 | Batter Rating | 31.5 |
| 0.0 | At Bats Per Home Run | 0.0 |
| 1.00 | Stolen Base Percentage | 0.50 |
| 3.71 | Pitches Per Plate Appearance | 3.75 |
| .032 | Isolated Power | .188 |
| 0.43 | Walk To Strikeout Ratio | 0.80 |
| .088 | Walks Per Plate Appearance | .111 |
| -.097 | Secondary Average Minus Batting Average | .063 |
| 2.0 | Runs Produced | 6.0 |
| 1.0 | Runs Ratio | 1.0 |
| 0.4 | Patience Ratio | 0.5 |
| 0.3 | Balls In Play Average | 0.3 |
| 71.5 | MLB Rating | 80.8 |
| 0.0 | Offensive Wins Above Replacement | 0.0 |
| 0.0 | Wins Above Replacement | 0.0 |
Game Information

Location: Boston, Massachusetts
Attendance: 33,548 | Capacity:
2025 National League East Standings
| TEAM | W | L | PCT | GB | STRK |
|---|---|---|---|---|---|
 Philadelphia Philadelphia |
96 | 66 | .593 | - | W1 |
 New York New York |
83 | 79 | .512 | 13 | L1 |
 Miami Miami |
79 | 83 | .488 | 17 | W1 |
 Atlanta Atlanta |
76 | 86 | .469 | 20 | W1 |
 Washington Washington |
66 | 96 | .407 | 30 | L1 |
2025 American League East Standings
| TEAM | W | L | PCT | GB | STRK |
|---|---|---|---|---|---|
 Toronto Toronto |
94 | 68 | .580 | - | W4 |
 New York New York |
94 | 68 | .580 | - | W8 |
 Boston Boston |
89 | 73 | .549 | 5 | W1 |
 Tampa Bay Tampa Bay |
77 | 85 | .475 | 17 | L4 |
 Baltimore Baltimore |
75 | 87 | .463 | 19 | L3 |