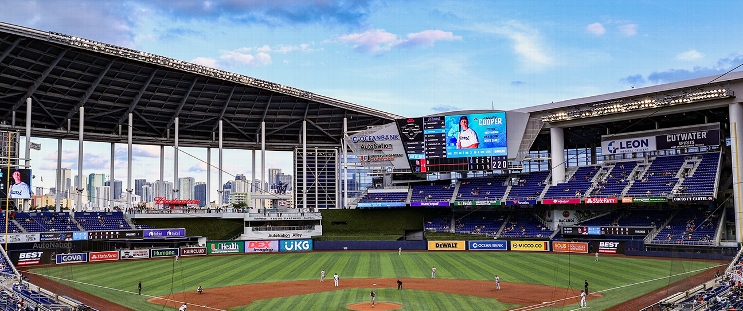
Chicago Cubs at Miami Marlins
· Major League Baseball
2 - 1

Kyle Tucker homers for second straight game and helps Cubs beat the Marlins 2-1

The NL Central-leading Cubs took two games of the three-game set against Miami after a walk-off loss on Monday and have won seven of their last nine games.
Chicago rookie Matt Shaw drew a leadoff walk against Marlins reliever Anthony Bender (1-3) in the eighth and stole second. Tucker’s second single advanced Shaw, who then sprinted home with the eventual game-winning run when Marlins left-fielder Kyle Stowers overran the ball.
Brad Keller (1-0) threw 1 1/3 innings of relief and earned his first win since 2023. Daniel Palencia worked a perfect ninth for his first save.
For the second consecutive day, Tucker gave the Cubs a first inning lead with a solo homer. Tucker sent a slider from Marlins starter Max Meyer 385 feet over the wall in right for his 12th homer.
The Marlins tied it in the bottom half on Connor Norby’s RBI infield single.
Meyer allowed one run and five hits over six innings with a walk and four strikeouts.
Making his second major league start, Cubs right-hander Cade Horton threw 5 1/3 innings of one-run ball. He allowed six hits, walked three and struck out three.
How can I watch Chicago Cubs vs. Miami Marlins?
- TV Channel: Cubs at Marlins 2022 MLB Baseball, is broadcasted on MLB.TV.
- Online streaming: Sign up for Fubo.
Scoring Summary
 |
9th Inning | Pauley flied out to left. |
 |
9th Inning | Hicks flied out to center. |
 |
9th Inning | Hicks hit for Fortes |
 |
9th Inning | Norby flied out to left. |
 |
9th Inning | Palencia relieved Keller |
 |
9th Inning | Amaya singled to left, Busch thrown out at home. |
Statistics
 CHC CHC |
 MIA MIA |
|
|---|---|---|
| 1 | Games Played | 1 |
| 1 | Team Games Played | 1 |
| 0 | Hit By Pitch | 0 |
| 10 | Ground Balls | 17 |
| 8 | Strikeouts | 3 |
| 1 | Runs Batted In | 1 |
| 0 | Sacrifice Hit | 0 |
| 8 | Hits | 6 |
| 2 | Stolen Bases | 0 |
| 2 | Walks | 4 |
| 0 | Catcher Interference | 0 |
| 2 | Runs | 1 |
| 0 | Ground Into Double Play | 2 |
| 0 | Sacrifice Flies | 0 |
| 33 | At Bats | 31 |
| 1 | Home Runs | 0 |
| 0 | Grand Slam Home Runs | 0 |
| 11 | Runners Left On Base | 15 |
| 0 | Triples | 0 |
| 0 | Game Winning RBIs | 0 |
| 0 | Intentional Walks | 0 |
| 2 | Doubles | 1 |
| 15 | Fly Balls | 11 |
| 0 | Caught Stealing | 0 |
| 148 | Pitches | 140 |
| 0 | Games Started | 0 |
| 0 | Pinch At Bats | 2 |
| 0 | Pinch Hits | 0 |
| 0.0 | Player Rating | 0.0 |
| 1 | Is Qualified | 1 |
| 1 | Is Qualified In Steals | 0 |
| 13 | Total Bases | 7 |
| 35 | Plate Appearances | 35 |
| 162.0 | Projected Home Runs | 0.0 |
| 3 | Extra Base Hits | 1 |
| 4.2 | Runs Created | 1.5 |
| .242 | Batting Average | .194 |
| .000 | Pinch Hit Average | .000 |
| .394 | Slugging Percentage | .226 |
| .273 | Secondary Average | .161 |
| .286 | On Base Percentage | .286 |
| .680 | OBP Pct + SLG Pct | .512 |
| 0.7 | Ground To Fly Ball Ratio | 1.5 |
| 4.5 | Runs Created Per 27 Outs | 1.5 |
| 23.0 | Batter Rating | 12.0 |
| 33.0 | At Bats Per Home Run | 0.0 |
| 1.00 | Stolen Base Percentage | 0.00 |
| 4.23 | Pitches Per Plate Appearance | 4.00 |
| .152 | Isolated Power | .032 |
| 0.25 | Walk To Strikeout Ratio | 1.33 |
| .057 | Walks Per Plate Appearance | .114 |
| .030 | Secondary Average Minus Batting Average | -.032 |
| 3.0 | Runs Produced | 2.0 |
| 0.5 | Runs Ratio | 1.0 |
| 0.4 | Patience Ratio | 0.3 |
| 0.3 | Balls In Play Average | 0.2 |
| 75.8 | MLB Rating | 68.0 |
| 0.0 | Offensive Wins Above Replacement | 0.0 |
| 0.0 | Wins Above Replacement | 0.0 |
Game Information

Location: Miami, Florida
Attendance: 7,482 | Capacity:
2025 National League Central Standings
| TEAM | W | L | PCT | GB | STRK |
|---|---|---|---|---|---|
 Milwaukee Milwaukee |
97 | 65 | .599 | - | W1 |
 Chicago Chicago |
92 | 70 | .568 | 5 | W3 |
 Cincinnati Cincinnati |
83 | 79 | .512 | 14 | L1 |
 St. Louis St. Louis |
78 | 84 | .481 | 19 | L4 |
 Pittsburgh Pittsburgh |
71 | 91 | .438 | 26 | L1 |
2025 National League East Standings
| TEAM | W | L | PCT | GB | STRK |
|---|---|---|---|---|---|
 Philadelphia Philadelphia |
96 | 66 | .593 | - | W1 |
 New York New York |
83 | 79 | .512 | 13 | L1 |
 Miami Miami |
79 | 83 | .488 | 17 | W1 |
 Atlanta Atlanta |
76 | 86 | .469 | 20 | W1 |
 Washington Washington |
66 | 96 | .407 | 30 | L1 |