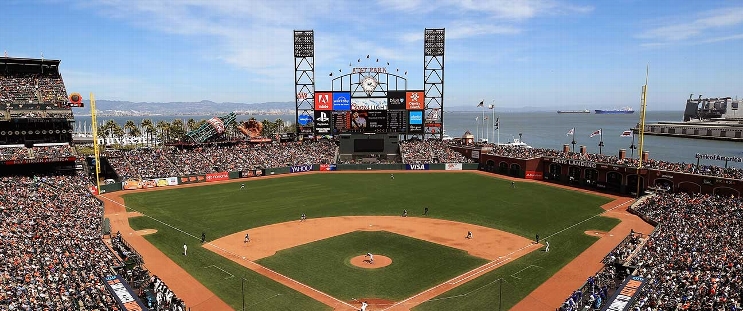
Kansas City Royals at San Francisco Giants
· Major League Baseball
8 - 4

Perez powers Royals with 3 hits, including a homer, in 8-4 win over Giants

The Royals had scored three runs or fewer in their previous seven games and were held to four runs or fewer in 42 of their first 50 games.
Kansas City led 3-1 in the top of the fourth when Perez hit an opposite field homer off Giants starter Logan Webb (5-4) with Witt aboard.
The Royals extended the lead to 8-2 in the fifth, when Drew Waters hit a leadoff double during a two-run inning.
Matt Chapman, Patrick Bailey and Heliot Ramos homered for San Francisco.
Ramos hit a two-run homer in the ninth off Lucas Erceg to cut the lead to 8-4.
Jonathan Bowlan (1-0) gave up one run on two hits in 1 1/3 innings in relief of opener Daniel Lynch IV, who walked three and gave up a hit in 1 2/3 innings.
Webb (5-4) gave up six runs (three earned) on 10 hits in four innings. The Giants’ ace struck out five and walked none.
How can I watch Kansas City Royals vs. San Francisco Giants?
- TV Channel: Royals at Giants 2022 MLB Baseball, is broadcasted on MLB.TV.
- Online streaming: Sign up for Fubo.
Scoring Summary
 |
9th Inning | Adames struck out swinging. |
 |
9th Inning | Flores lined out to right. |
 |
9th Inning | Lee walked. |
 |
9th Inning | Chapman grounded out to shortstop. |
 |
9th Inning | Ramos homered to left center (387 feet), Wade Jr. scored. |
 |
9th Inning | Wade Jr. singled to right. |
Statistics
 KC KC |
 SF SF |
|
|---|---|---|
| 1 | Games Played | 1 |
| 1 | Team Games Played | 1 |
| 1 | Hit By Pitch | 0 |
| 17 | Ground Balls | 12 |
| 5 | Strikeouts | 7 |
| 8 | Runs Batted In | 4 |
| 1 | Sacrifice Hit | 0 |
| 16 | Hits | 8 |
| 1 | Stolen Bases | 0 |
| 0 | Walks | 6 |
| 0 | Catcher Interference | 0 |
| 8 | Runs | 4 |
| 0 | Ground Into Double Play | 0 |
| 2 | Sacrifice Flies | 0 |
| 40 | At Bats | 35 |
| 1 | Home Runs | 3 |
| 0 | Grand Slam Home Runs | 0 |
| 19 | Runners Left On Base | 16 |
| 0 | Triples | 0 |
| 1 | Game Winning RBIs | 0 |
| 0 | Intentional Walks | 0 |
| 3 | Doubles | 1 |
| 21 | Fly Balls | 16 |
| 0 | Caught Stealing | 0 |
| 133 | Pitches | 176 |
| 0 | Games Started | 0 |
| 0 | Pinch At Bats | 0 |
| 0 | Pinch Hits | 0 |
| 0.0 | Player Rating | 0.0 |
| 1 | Is Qualified | 1 |
| 1 | Is Qualified In Steals | 0 |
| 22 | Total Bases | 18 |
| 44 | Plate Appearances | 41 |
| 162.0 | Projected Home Runs | 486.0 |
| 4 | Extra Base Hits | 4 |
| 8.8 | Runs Created | 6.5 |
| .400 | Batting Average | .229 |
| .000 | Pinch Hit Average | .000 |
| .550 | Slugging Percentage | .514 |
| .175 | Secondary Average | .457 |
| .395 | On Base Percentage | .341 |
| .945 | OBP Pct + SLG Pct | .856 |
| 0.8 | Ground To Fly Ball Ratio | 0.8 |
| 8.8 | Runs Created Per 27 Outs | 6.5 |
| 58.0 | Batter Rating | 35.0 |
| 40.0 | At Bats Per Home Run | 11.7 |
| 1.00 | Stolen Base Percentage | 0.00 |
| 3.02 | Pitches Per Plate Appearance | 4.29 |
| .150 | Isolated Power | .286 |
| 0.00 | Walk To Strikeout Ratio | 0.86 |
| .000 | Walks Per Plate Appearance | .146 |
| -.225 | Secondary Average Minus Batting Average | .229 |
| 16.0 | Runs Produced | 8.0 |
| 1.0 | Runs Ratio | 1.0 |
| 0.5 | Patience Ratio | 0.6 |
| 0.4 | Balls In Play Average | 0.2 |
| 107.0 | MLB Rating | 86.0 |
| 0.0 | Offensive Wins Above Replacement | 0.0 |
| 0.0 | Wins Above Replacement | 0.0 |
Game Information

Location: San Francisco, California
Attendance: 29,064 | Capacity:
2025 American League Central Standings
| TEAM | W | L | PCT | GB | STRK |
|---|---|---|---|---|---|
 Cleveland Cleveland |
88 | 74 | .543 | - | W2 |
 Detroit Detroit |
87 | 75 | .537 | 1 | L1 |
 Kansas City Kansas City |
82 | 80 | .506 | 6 | W2 |
 Minnesota Minnesota |
70 | 92 | .432 | 18 | L1 |
 Chicago Chicago |
60 | 102 | .370 | 28 | W1 |
2025 National League West Standings
| TEAM | W | L | PCT | GB | STRK |
|---|---|---|---|---|---|
 Los Angeles Los Angeles |
93 | 69 | .574 | - | W5 |
 San Diego San Diego |
90 | 72 | .556 | 3 | W3 |
 San Francisco San Francisco |
81 | 81 | .500 | 12 | W4 |
 Arizona Arizona |
80 | 82 | .494 | 13 | L5 |
 Colorado Colorado |
43 | 119 | .265 | 50 | L6 |