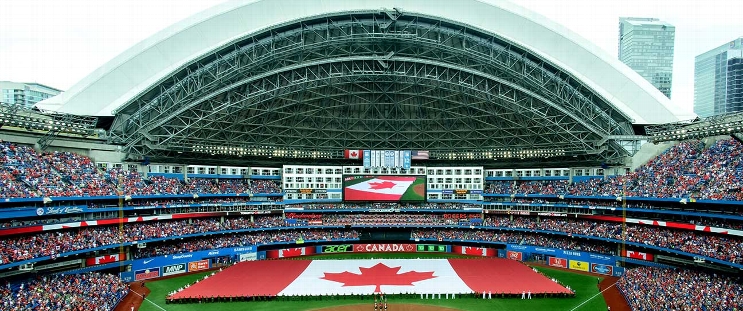
San Diego Padres at Toronto Blue Jays
· Major League Baseball
6 - 7

Lukes has winning hit in 11th as Blue Jays win 7-6, hand slumping Padres 6th straight loss

Gavin Sheets hit two home runs and had five RBI for San Diego, but the Padres couldn’t hold on after twice taking the lead in extra innings.
Luis Arraez gave San Diego a 5-4 lead with a two-out RBI single to center off Brendon Little in the 10th, but Toronto’s Jonatan Clase led off the bottom half with a game-tying single off Robert Suarez, who blew his second save opportunity in 17 chances.
Sheets hit an RBI single off Brendon Little in the 11th, but Daulton Varsho led off the bottom half with an RBI triple off Jeremiah Estrada (1-3).
San Diego intentionally walked Addison Barger and Ernie Clement flied out before Lukes grounded the winning hit through a drawn-in infield.
Toronto’s Braydon Fisher (1-0) got one out for the win.
Sheets went 3 for 5 with five RBI. He hit a two-run home run in the second and added a game-tying, two-run blast off Blue Jays closer Jeff Hoffman in the ninth.
The blown save was Hoffman’s third in 13 chances.
It was the third multi-homer game of Sheets’ career and his first since 2022. The homers were his seventh and eighth.
Toronto’s Anthony Santander was held out of the starting lineup. Santander left Wednesday’s game in the seventh because of left hip inflammation.
Blue Jays: LHP Eric Lauer (1-0, 2.25 ERA) is scheduled to start Friday’s game at Tampa Bay.
How can I watch San Diego Padres vs. Toronto Blue Jays?
- TV Channel: Padres at Blue Jays 2022 MLB Baseball, is broadcasted on MLB.TV.
- Online streaming: Sign up for Fubo.
Scoring Summary
 |
11th Inning | Lukes singled to left, Varsho scored, Barger to second. |
 |
11th Inning | Clement flied out to right. |
 |
11th Inning | Barger intentionally walked. |
 |
11th Inning | Varsho tripled to right, Guerrero Jr. scored. |
 |
11th Inning | Estrada relieved Suarez |
 |
11th Inning | Díaz flied out to center. |
Statistics
 SD SD |
 TOR TOR |
|
|---|---|---|
| 1 | Games Played | 1 |
| 1 | Team Games Played | 1 |
| 0 | Hit By Pitch | 1 |
| 9 | Ground Balls | 16 |
| 11 | Strikeouts | 7 |
| 6 | Runs Batted In | 6 |
| 0 | Sacrifice Hit | 0 |
| 8 | Hits | 12 |
| 0 | Stolen Bases | 1 |
| 4 | Walks | 7 |
| 0 | Catcher Interference | 0 |
| 6 | Runs | 7 |
| 1 | Ground Into Double Play | 1 |
| 0 | Sacrifice Flies | 1 |
| 39 | At Bats | 42 |
| 2 | Home Runs | 0 |
| 0 | Grand Slam Home Runs | 0 |
| 16 | Runners Left On Base | 30 |
| 0 | Triples | 1 |
| 0 | Game Winning RBIs | 1 |
| 0 | Intentional Walks | 1 |
| 1 | Doubles | 1 |
| 19 | Fly Balls | 20 |
| 1 | Caught Stealing | 0 |
| 194 | Pitches | 181 |
| 0 | Games Started | 0 |
| 1 | Pinch At Bats | 2 |
| 0 | Pinch Hits | 1 |
| 0.0 | Player Rating | 0.0 |
| 1 | Is Qualified | 1 |
| 1 | Is Qualified In Steals | 1 |
| 15 | Total Bases | 15 |
| 43 | Plate Appearances | 51 |
| 324.0 | Projected Home Runs | 0.0 |
| 3 | Extra Base Hits | 2 |
| 3.6 | Runs Created | 6.8 |
| .205 | Batting Average | .286 |
| .000 | Pinch Hit Average | .500 |
| .385 | Slugging Percentage | .357 |
| .256 | Secondary Average | .262 |
| .279 | On Base Percentage | .392 |
| .664 | OBP Pct + SLG Pct | .749 |
| 0.5 | Ground To Fly Ball Ratio | 0.8 |
| 3.0 | Runs Created Per 27 Outs | 5.7 |
| 40.0 | Batter Rating | 43.5 |
| 19.5 | At Bats Per Home Run | 0.0 |
| 0.00 | Stolen Base Percentage | 1.00 |
| 4.51 | Pitches Per Plate Appearance | 3.55 |
| .179 | Isolated Power | .071 |
| 0.36 | Walk To Strikeout Ratio | 1.00 |
| .093 | Walks Per Plate Appearance | .137 |
| .051 | Secondary Average Minus Batting Average | -.024 |
| 12.0 | Runs Produced | 13.0 |
| 1.0 | Runs Ratio | 0.9 |
| 0.5 | Patience Ratio | 0.5 |
| 0.2 | Balls In Play Average | 0.3 |
| 84.3 | MLB Rating | 92.3 |
| 0.0 | Offensive Wins Above Replacement | 0.0 |
| 0.0 | Wins Above Replacement | 0.0 |
Game Information

Location: Toronto, Ontario
Attendance: 33,971 | Capacity:
2025 National League West Standings
| TEAM | W | L | PCT | GB | STRK |
|---|---|---|---|---|---|
 Los Angeles Los Angeles |
93 | 69 | .574 | - | W5 |
 San Diego San Diego |
90 | 72 | .556 | 3 | W3 |
 San Francisco San Francisco |
81 | 81 | .500 | 12 | W4 |
 Arizona Arizona |
80 | 82 | .494 | 13 | L5 |
 Colorado Colorado |
43 | 119 | .265 | 50 | L6 |
2025 American League East Standings
| TEAM | W | L | PCT | GB | STRK |
|---|---|---|---|---|---|
 Toronto Toronto |
94 | 68 | .580 | - | W4 |
 New York New York |
94 | 68 | .580 | - | W8 |
 Boston Boston |
89 | 73 | .549 | 5 | W1 |
 Tampa Bay Tampa Bay |
77 | 85 | .475 | 17 | L4 |
 Baltimore Baltimore |
75 | 87 | .463 | 19 | L3 |