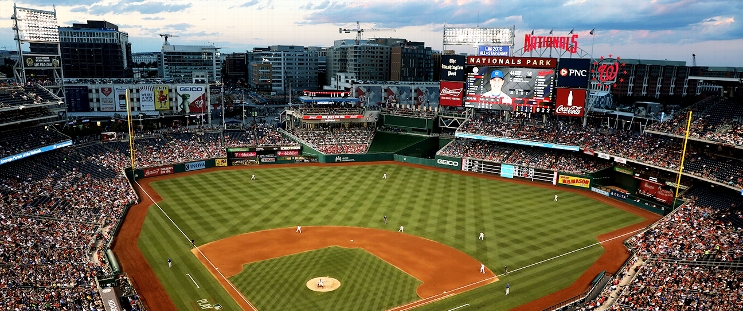
San Francisco Giants at Washington Nationals
· Major League Baseball
4 - 0

Roupp pitches into seventh inning, Giants beat Nationals 4-0

Roupp (3-3) allowed five hits, struck out two and walked two before leaving after allowing a double and a walk to start the seventh.
Nationals starter MacKenzie Gore (2-5) also pitched in the seventh. After walking Lee to open the inning, Gore grimaced following a 1-0 pitch to Matt Chapman. Manager Dave Martinez and the trainer came out and, after a brief discussion, Gore left the game.
Gore said his left leg tightened up after he was hit by a comebacker earlier in the game.
Jackson Rutledge came on and walked Chapman to put runners on first and second with no outs. Wilmer Flores hit into a double play, but Willy Adames singled to score Lee from third and give the Giants a 1-0 lead. Rutledge then walked three straight hitters to force in San Francisco's second run.
Gore was charged with a run and two hits. He struck out nine and walked three while throwing 91 pitches. He bounced back from a start in which he allowed two runs and 10 hits in 3 2/3 innings while striking out nine in a no-decision against the Orioles.
The Giants scored two more runs in the eighth on Wilmer Flores' RBI single and a wild pitch by Andrew Chafin with the bases loaded.
Nationals outfielder Daylen Lile went 1 for 2 in his major league debut.
How can I watch San Francisco Giants vs. Washington Nationals?
- TV Channel: Giants at Nationals 2022 MLB Baseball, is broadcasted on MLB.TV.
- Online streaming: Sign up for Fubo.
Scoring Summary
 |
9th Inning | García Jr. lined out to left. |
 |
9th Inning | Ruiz flied out to center. |
 |
9th Inning | Lowe popped out to shortstop. |
 |
9th Inning | Doval relieved Miller |
 |
9th Inning | Ramos picked off and caught stealing second. |
 |
9th Inning | Ramos reached on infield single to second. |
Statistics
 SF SF |
 WSH WSH |
|
|---|---|---|
| 1 | Games Played | 1 |
| 1 | Team Games Played | 1 |
| 1 | Hit By Pitch | 0 |
| 8 | Ground Balls | 13 |
| 13 | Strikeouts | 3 |
| 3 | Runs Batted In | 0 |
| 0 | Sacrifice Hit | 0 |
| 7 | Hits | 5 |
| 0 | Stolen Bases | 0 |
| 6 | Walks | 3 |
| 0 | Catcher Interference | 0 |
| 4 | Runs | 0 |
| 2 | Ground Into Double Play | 2 |
| 0 | Sacrifice Flies | 0 |
| 30 | At Bats | 29 |
| 0 | Home Runs | 0 |
| 0 | Grand Slam Home Runs | 0 |
| 13 | Runners Left On Base | 13 |
| 0 | Triples | 0 |
| 1 | Game Winning RBIs | 0 |
| 0 | Intentional Walks | 0 |
| 0 | Doubles | 3 |
| 9 | Fly Balls | 13 |
| 1 | Caught Stealing | 0 |
| 162 | Pitches | 111 |
| 0 | Games Started | 0 |
| 0 | Pinch At Bats | 0 |
| 0 | Pinch Hits | 0 |
| 0.0 | Player Rating | 0.0 |
| 1 | Is Qualified | 1 |
| 1 | Is Qualified In Steals | 0 |
| 7 | Total Bases | 8 |
| 37 | Plate Appearances | 32 |
| 0.0 | Projected Home Runs | 0.0 |
| 0 | Extra Base Hits | 3 |
| 2.5 | Runs Created | 1.3 |
| .233 | Batting Average | .172 |
| .000 | Pinch Hit Average | .000 |
| .233 | Slugging Percentage | .276 |
| .167 | Secondary Average | .207 |
| .378 | On Base Percentage | .250 |
| .612 | OBP Pct + SLG Pct | .526 |
| 0.9 | Ground To Fly Ball Ratio | 1.0 |
| 2.6 | Runs Created Per 27 Outs | 1.3 |
| 21.0 | Batter Rating | 11.0 |
| 0.0 | At Bats Per Home Run | 0.0 |
| 0.00 | Stolen Base Percentage | 0.00 |
| 4.38 | Pitches Per Plate Appearance | 3.47 |
| .000 | Isolated Power | .103 |
| 0.46 | Walk To Strikeout Ratio | 1.00 |
| .162 | Walks Per Plate Appearance | .094 |
| -.067 | Secondary Average Minus Batting Average | .034 |
| 7.0 | Runs Produced | 0.0 |
| 0.8 | Runs Ratio | 0.0 |
| 0.4 | Patience Ratio | 0.4 |
| 0.4 | Balls In Play Average | 0.2 |
| 72.5 | MLB Rating | 66.0 |
| 0.0 | Offensive Wins Above Replacement | 0.0 |
| 0.0 | Wins Above Replacement | 0.0 |
Game Information

Location: Washington, District of Columbia
Attendance: 19,195 | Capacity:
2025 National League West Standings
| TEAM | W | L | PCT | GB | STRK |
|---|---|---|---|---|---|
 Los Angeles Los Angeles |
34 | 22 | .607 | - | L1 |
 San Diego San Diego |
31 | 23 | .574 | 2 | L1 |
 San Francisco San Francisco |
31 | 25 | .554 | 3 | L3 |
 Arizona Arizona |
27 | 29 | .482 | 7 | L2 |
 Colorado Colorado |
9 | 47 | .161 | 25 | L5 |
2025 National League East Standings
| TEAM | W | L | PCT | GB | STRK |
|---|---|---|---|---|---|
 Philadelphia Philadelphia |
36 | 20 | .643 | - | L1 |
 New York New York |
34 | 22 | .607 | 2 | L1 |
 Atlanta Atlanta |
26 | 29 | .473 | 9.5 | W1 |
 Washington Washington |
26 | 30 | .464 | 10 | W2 |
 Miami Miami |
22 | 32 | .407 | 13 | W1 |