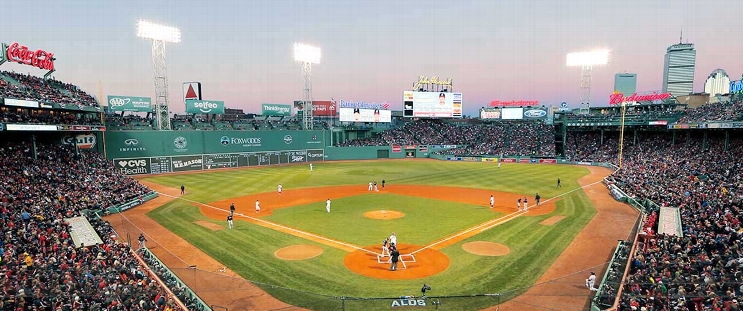
Baltimore Orioles at Boston Red Sox
· Major League Baseball
5 - 1

Ryan O'Hearn, Dylan Carlson homer as Orioles beat Red Sox 5-1 to salvage series split

The victory gave Baltimore its first consecutive wins since April 30 and May 2 after it earned a split of the day-night doubleheader Saturday by winning the second game.
Jarren Duran had four singles for the Red Sox and highly touted prospect Marcelo Mayer earned his first major league hit — a single — and added a double.
It was the second straight game that Boston’s offense has struggled after it learned Alex Bregman, one of its better offensive players, was lost for a while with a strained right quadriceps.
The Orioles won for just the third time in 13 games.
Baltimore catcher Adley Rutschman left the game after taking a hard foul off the mask.
Orioles starter Dean Kremer (4-5) allowed seven singles in 5 1/3 innings.
Starting after getting ejected early in his previous start, Walker Buehler (4-2) gave up two runs in five innings.
Carlson hit his first homer with the Orioles into the right-field seats to make it 2-0.
Red Sox: Open a three-game series in Milwaukee on Monday when LHP Garrett Crochet (4-3, 1.98) is set to face Brewers RHP Chad Patrick (2-4, 3.23).
How can I watch Baltimore Orioles vs. Boston Red Sox?
- TV Channel: Orioles at Red Sox 2022 MLB Baseball, is broadcasted on MLB.TV.
- Online streaming: Sign up for Fubo.
Scoring Summary
 |
9th Inning | Duran struck out swinging. |
 |
9th Inning | Rafaela to second on fielder's indifference. |
 |
9th Inning | Rafaela grounded into fielder's choice to third, Toro out at second. |
 |
9th Inning | Sogard struck out looking. |
 |
9th Inning | Toro singled to center, Mayer scored. |
 |
9th Inning | Mayer doubled to right. |
Statistics
 BAL BAL |
 BOS BOS |
|
|---|---|---|
| 1 | Games Played | 1 |
| 1 | Team Games Played | 1 |
| 0 | Hit By Pitch | 0 |
| 14 | Ground Balls | 14 |
| 5 | Strikeouts | 8 |
| 3 | Runs Batted In | 1 |
| 0 | Sacrifice Hit | 0 |
| 7 | Hits | 10 |
| 3 | Stolen Bases | 1 |
| 3 | Walks | 1 |
| 0 | Catcher Interference | 0 |
| 5 | Runs | 1 |
| 1 | Ground Into Double Play | 1 |
| 1 | Sacrifice Flies | 0 |
| 33 | At Bats | 36 |
| 2 | Home Runs | 0 |
| 0 | Grand Slam Home Runs | 0 |
| 10 | Runners Left On Base | 21 |
| 0 | Triples | 0 |
| 1 | Game Winning RBIs | 0 |
| 0 | Intentional Walks | 0 |
| 2 | Doubles | 2 |
| 15 | Fly Balls | 14 |
| 0 | Caught Stealing | 0 |
| 143 | Pitches | 147 |
| 0 | Games Started | 0 |
| 1 | Pinch At Bats | 1 |
| 0 | Pinch Hits | 0 |
| 0.0 | Player Rating | 0.0 |
| 1 | Is Qualified | 1 |
| 1 | Is Qualified In Steals | 1 |
| 15 | Total Bases | 12 |
| 37 | Plate Appearances | 37 |
| 324.0 | Projected Home Runs | 0.0 |
| 4 | Extra Base Hits | 2 |
| 4.6 | Runs Created | 3.4 |
| .212 | Batting Average | .278 |
| .000 | Pinch Hit Average | .000 |
| .455 | Slugging Percentage | .333 |
| .424 | Secondary Average | .111 |
| .270 | On Base Percentage | .297 |
| .725 | OBP Pct + SLG Pct | .631 |
| 0.9 | Ground To Fly Ball Ratio | 1.0 |
| 4.4 | Runs Created Per 27 Outs | 3.4 |
| 36.0 | Batter Rating | 19.0 |
| 16.5 | At Bats Per Home Run | 0.0 |
| 1.00 | Stolen Base Percentage | 1.00 |
| 3.86 | Pitches Per Plate Appearance | 3.97 |
| .242 | Isolated Power | .056 |
| 0.60 | Walk To Strikeout Ratio | 0.13 |
| .081 | Walks Per Plate Appearance | .027 |
| .212 | Secondary Average Minus Batting Average | -.167 |
| 8.0 | Runs Produced | 2.0 |
| 0.6 | Runs Ratio | 1.0 |
| 0.5 | Patience Ratio | 0.4 |
| 0.2 | Balls In Play Average | 0.4 |
| 83.0 | MLB Rating | 75.0 |
| 0.0 | Offensive Wins Above Replacement | 0.0 |
| 0.0 | Wins Above Replacement | 0.0 |
Game Information

Location: Boston, Massachusetts
Attendance: 36,824 | Capacity:
2025 American League East Standings
| TEAM | W | L | PCT | GB | STRK |
|---|---|---|---|---|---|
 Toronto Toronto |
94 | 68 | .580 | - | W4 |
 New York New York |
94 | 68 | .580 | - | W8 |
 Boston Boston |
89 | 73 | .549 | 5 | W1 |
 Tampa Bay Tampa Bay |
77 | 85 | .475 | 17 | L4 |
 Baltimore Baltimore |
75 | 87 | .463 | 19 | L3 |