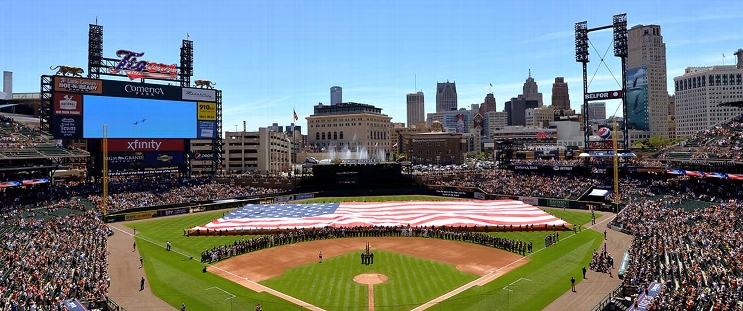
San Francisco Giants at Detroit Tigers
· Major League Baseball
1 - 3

Keider Montero, Riley Greene lead Tigers to 3-1 win over Giants

Montero (2-1) entered the game with a 5.28 ERA in six games, but held the Giants to one hit and two walks while striking out three.
Five relievers finished, with Will Vest pitching the ninth for his sixth save.
Hayden Birdsong (2-1) took the loss, giving up three runs on five hits and two walks in 4 1/3 innings.
The Tigers took a 1-0 lead in the fourth on Dillon Dingler's RBI single, and they added two runs in the fifth.
With one out, Detroit loaded the bases on a single and two walks before Greene looped a two-run single into center. Reliever Erik Miller avoided a worse outcome by intentionally walking Spencer Torkelson and getting Zach McKinstry to hit into an inning-ending double play.
Wilmer Flores' RBI single made it 3-1 in the sixth, but the Giants failed to get a runner into scoring position in the last three innings.
How can I watch San Francisco Giants vs. Detroit Tigers?
- TV Channel: Giants at Tigers 2022 MLB Baseball, is broadcasted on MLB.TV.
- Online streaming: Sign up for Fubo.
Scoring Summary
 |
9th Inning | Fitzgerald lined out to right. |
 |
9th Inning | Wade Jr. struck out looking. |
 |
9th Inning | Adames grounded into fielder's choice to shortstop, Flores out at second. |
 |
9th Inning | Flores singled to right. |
 |
9th Inning | Vest relieved Kahnle |
 |
8th Inning | Dingler grounded out to shortstop. |
Statistics
 SF SF |
 DET DET |
|
|---|---|---|
| 1 | Games Played | 1 |
| 1 | Team Games Played | 1 |
| 0 | Hit By Pitch | 0 |
| 12 | Ground Balls | 7 |
| 4 | Strikeouts | 8 |
| 1 | Runs Batted In | 3 |
| 0 | Sacrifice Hit | 0 |
| 5 | Hits | 7 |
| 0 | Stolen Bases | 0 |
| 3 | Walks | 4 |
| 0 | Catcher Interference | 0 |
| 1 | Runs | 3 |
| 1 | Ground Into Double Play | 1 |
| 0 | Sacrifice Flies | 0 |
| 31 | At Bats | 30 |
| 0 | Home Runs | 0 |
| 0 | Grand Slam Home Runs | 0 |
| 13 | Runners Left On Base | 13 |
| 0 | Triples | 0 |
| 0 | Game Winning RBIs | 1 |
| 0 | Intentional Walks | 1 |
| 0 | Doubles | 1 |
| 15 | Fly Balls | 15 |
| 0 | Caught Stealing | 0 |
| 132 | Pitches | 132 |
| 0 | Games Started | 0 |
| 0 | Pinch At Bats | 0 |
| 0 | Pinch Hits | 0 |
| 0.0 | Player Rating | 0.0 |
| 1 | Is Qualified | 1 |
| 0 | Is Qualified In Steals | 0 |
| 5 | Total Bases | 8 |
| 34 | Plate Appearances | 34 |
| 0.0 | Projected Home Runs | 0.0 |
| 0 | Extra Base Hits | 1 |
| 0.6 | Runs Created | 2.6 |
| .161 | Batting Average | .233 |
| .000 | Pinch Hit Average | .000 |
| .161 | Slugging Percentage | .267 |
| .097 | Secondary Average | .167 |
| .235 | On Base Percentage | .324 |
| .397 | OBP Pct + SLG Pct | .590 |
| 0.8 | Ground To Fly Ball Ratio | 0.5 |
| 0.6 | Runs Created Per 27 Outs | 2.9 |
| 9.0 | Batter Rating | 21.0 |
| 0.0 | At Bats Per Home Run | 0.0 |
| 0.00 | Stolen Base Percentage | 0.00 |
| 3.88 | Pitches Per Plate Appearance | 3.88 |
| .000 | Isolated Power | .033 |
| 0.75 | Walk To Strikeout Ratio | 0.50 |
| .088 | Walks Per Plate Appearance | .118 |
| -.065 | Secondary Average Minus Batting Average | -.067 |
| 2.0 | Runs Produced | 6.0 |
| 1.0 | Runs Ratio | 1.0 |
| 0.2 | Patience Ratio | 0.4 |
| 0.2 | Balls In Play Average | 0.3 |
| 64.3 | MLB Rating | 73.3 |
| 0.0 | Offensive Wins Above Replacement | 0.0 |
| 0.0 | Wins Above Replacement | 0.0 |
Game Information

Location: Detroit, Michigan
Attendance: 31,640 | Capacity:
2025 National League West Standings
| TEAM | W | L | PCT | GB | STRK |
|---|---|---|---|---|---|
 Los Angeles Los Angeles |
93 | 69 | .574 | - | W5 |
 San Diego San Diego |
90 | 72 | .556 | 3 | W3 |
 San Francisco San Francisco |
81 | 81 | .500 | 12 | W4 |
 Arizona Arizona |
80 | 82 | .494 | 13 | L5 |
 Colorado Colorado |
43 | 119 | .265 | 50 | L6 |
2025 American League Central Standings
| TEAM | W | L | PCT | GB | STRK |
|---|---|---|---|---|---|
 Cleveland Cleveland |
88 | 74 | .543 | - | W2 |
 Detroit Detroit |
87 | 75 | .537 | 1 | L1 |
 Kansas City Kansas City |
82 | 80 | .506 | 6 | W2 |
 Minnesota Minnesota |
70 | 92 | .432 | 18 | L1 |
 Chicago Chicago |
60 | 102 | .370 | 28 | W1 |