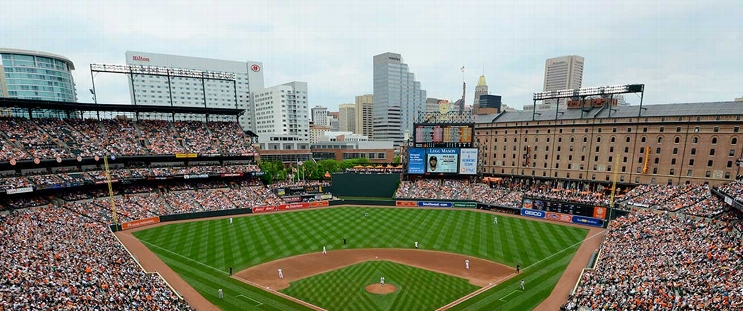
St. Louis Cardinals at Baltimore Orioles
· Major League Baseball
2 - 5

Dylan Carlson's 3-run homer powers the Orioles to their 3rd straight win, 5-2 over the Cardinals

Carlson's drive in the fourth off Erick Fedde (3-4) put the Orioles up 5-0. Morton (1-7) took a shutout into the fifth before allowing a two-run shot by Pedro Pagés. The 41-year-old right-hander, who signed with Baltimore in the offseason, allowed four hits in six innings after losing his first six starts of the season. He'd pitched mostly in relief lately.
After Morton exited, three Baltimore relievers — Seranthony Domínguez, Yennier Cano and Félix Bautista — retired all nine of their hitters. Bautista pitched the ninth for his eighth save in nine chances.
Fedde allowed three earned runs in five innings and did not get much help from his infielders. After a leadoff single by Jackson Holliday in the first, Ramón Urías hit a grounder to third, but Nolan Gorman threw wildly to second for an error. Holliday went to third and then scored one batter later.
With one out and a man on first in the fourth, St. Louis second baseman Brendan Donovan fielded a grounder, but his throw to second hit the runner for another error. Carlson followed with his home run.
How can I watch St. Louis Cardinals vs. Baltimore Orioles?
- TV Channel: Cardinals at Orioles 2022 MLB Baseball, is broadcasted on MLB.TV.
- Online streaming: Sign up for Fubo.
Scoring Summary
 |
9th Inning | Walker struck out swinging. |
 |
9th Inning | Herrera popped out to shortstop. |
 |
9th Inning | Contreras struck out swinging. |
 |
9th Inning | Bautista relieved Cano |
 |
8th Inning | Handley struck out swinging. |
 |
8th Inning | Carlson flied out to left. |
Statistics
 STL STL |
 BAL BAL |
|
|---|---|---|
| 1 | Games Played | 1 |
| 1 | Team Games Played | 1 |
| 1 | Hit By Pitch | 1 |
| 12 | Ground Balls | 12 |
| 10 | Strikeouts | 8 |
| 2 | Runs Batted In | 5 |
| 0 | Sacrifice Hit | 1 |
| 4 | Hits | 10 |
| 1 | Stolen Bases | 1 |
| 2 | Walks | 1 |
| 0 | Catcher Interference | 0 |
| 2 | Runs | 5 |
| 1 | Ground Into Double Play | 1 |
| 0 | Sacrifice Flies | 0 |
| 30 | At Bats | 33 |
| 1 | Home Runs | 1 |
| 0 | Grand Slam Home Runs | 0 |
| 10 | Runners Left On Base | 21 |
| 0 | Triples | 0 |
| 0 | Game Winning RBIs | 1 |
| 0 | Intentional Walks | 0 |
| 1 | Doubles | 0 |
| 8 | Fly Balls | 14 |
| 0 | Caught Stealing | 1 |
| 124 | Pitches | 137 |
| 0 | Games Started | 0 |
| 0 | Pinch At Bats | 0 |
| 0 | Pinch Hits | 0 |
| 0.0 | Player Rating | 0.0 |
| 1 | Is Qualified | 1 |
| 1 | Is Qualified In Steals | 1 |
| 8 | Total Bases | 13 |
| 33 | Plate Appearances | 36 |
| 162.0 | Projected Home Runs | 162.0 |
| 2 | Extra Base Hits | 1 |
| 1.3 | Runs Created | 4.0 |
| .133 | Batting Average | .303 |
| .000 | Pinch Hit Average | .000 |
| .267 | Slugging Percentage | .394 |
| .233 | Secondary Average | .121 |
| .212 | On Base Percentage | .343 |
| .479 | OBP Pct + SLG Pct | .737 |
| 1.5 | Ground To Fly Ball Ratio | 0.9 |
| 1.3 | Runs Created Per 27 Outs | 4.2 |
| 18.0 | Batter Rating | 34.0 |
| 30.0 | At Bats Per Home Run | 33.0 |
| 1.00 | Stolen Base Percentage | 0.50 |
| 3.76 | Pitches Per Plate Appearance | 3.81 |
| .133 | Isolated Power | .091 |
| 0.20 | Walk To Strikeout Ratio | 0.13 |
| .061 | Walks Per Plate Appearance | .028 |
| .100 | Secondary Average Minus Batting Average | -.182 |
| 4.0 | Runs Produced | 10.0 |
| 1.0 | Runs Ratio | 1.0 |
| 0.3 | Patience Ratio | 0.4 |
| 0.2 | Balls In Play Average | 0.4 |
| 67.0 | MLB Rating | 85.0 |
| 0.0 | Offensive Wins Above Replacement | 0.0 |
| 0.0 | Wins Above Replacement | 0.0 |
Game Information

Location: Baltimore, Maryland
Attendance: 21,717 | Capacity:
2025 National League Central Standings
| TEAM | W | L | PCT | GB | STRK |
|---|---|---|---|---|---|
 Milwaukee Milwaukee |
97 | 65 | .599 | - | W1 |
 Chicago Chicago |
92 | 70 | .568 | 5 | W3 |
 Cincinnati Cincinnati |
83 | 79 | .512 | 14 | L1 |
 St. Louis St. Louis |
78 | 84 | .481 | 19 | L4 |
 Pittsburgh Pittsburgh |
71 | 91 | .438 | 26 | L1 |
2025 American League East Standings
| TEAM | W | L | PCT | GB | STRK |
|---|---|---|---|---|---|
 Toronto Toronto |
94 | 68 | .580 | - | W4 |
 New York New York |
94 | 68 | .580 | - | W8 |
 Boston Boston |
89 | 73 | .549 | 5 | W1 |
 Tampa Bay Tampa Bay |
77 | 85 | .475 | 17 | L4 |
 Baltimore Baltimore |
75 | 87 | .463 | 19 | L3 |