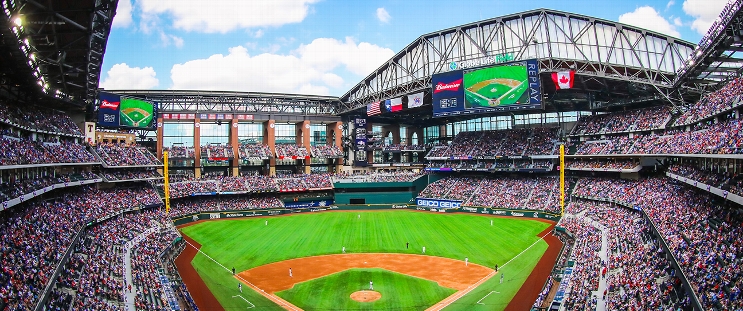
St. Louis Cardinals at Texas Rangers
· Major League Baseball
1 - 8

Smith drives in 4 runs, deGrom works 6 solid innings as Rangers beat Cardinals 8-1

The Rangers (29-31) won two of three games against St. Louis and won a series for the first time since sweeping struggling Colorado at home May 12-14.
The Cardinals (33-26) lost a series for just the second time in their last 11.
Smith sliced an outside changeup into the left-field corner in the second inning, punctuating a two-out rally that began with Marcus Semien’s single. Semien scored again in Texas' five-run eighth inning on Smith's homer to right.
DeGrom (5-2) allowed one run on four hits and three walks in six innings, striking out four.
Semien had two hits and two walks.
The Cardinals led 1-0 in the first inning when Lars Nootbaar led off with a walk and scored on Willson Contreras’ two-out single.
Erick Fedde (3-5) gave up two runs on four hits in six innings, walking three and striking out five. The 32-year-old right-hander was looking for his first victory since shutting out Washington on May 9 in his first complete game in the majors.
Rangers RHP Tyler Mahle (5-2, 1.64) will pitch Tuesday at Tampa Bay in the opener of a nine-game trip.
How can I watch St. Louis Cardinals vs. Texas Rangers?
- TV Channel: Cardinals at Rangers 2022 MLB Baseball, is broadcasted on Roku.
- Online streaming: Sign up for Fubo.
Scoring Summary
 |
9th Inning | Burleson grounded out to first. |
 |
9th Inning | Arenado safe at first on throwing error by third baseman Jung. |
 |
9th Inning | Herrera struck out swinging. |
 |
9th Inning | Contreras lined out to third. |
 |
9th Inning | Jackson relieved Milner |
 |
8th Inning | Langford struck out swinging. |
Statistics
 STL STL |
 TEX TEX |
|
|---|---|---|
| 1 | Games Played | 1 |
| 1 | Team Games Played | 1 |
| 0 | Hit By Pitch | 0 |
| 13 | Ground Balls | 10 |
| 6 | Strikeouts | 6 |
| 1 | Runs Batted In | 8 |
| 0 | Sacrifice Hit | 1 |
| 5 | Hits | 9 |
| 0 | Stolen Bases | 3 |
| 3 | Walks | 5 |
| 0 | Catcher Interference | 0 |
| 1 | Runs | 8 |
| 1 | Ground Into Double Play | 0 |
| 0 | Sacrifice Flies | 2 |
| 31 | At Bats | 30 |
| 0 | Home Runs | 1 |
| 0 | Grand Slam Home Runs | 0 |
| 11 | Runners Left On Base | 14 |
| 0 | Triples | 0 |
| 0 | Game Winning RBIs | 1 |
| 0 | Intentional Walks | 0 |
| 0 | Doubles | 4 |
| 12 | Fly Balls | 17 |
| 1 | Caught Stealing | 0 |
| 119 | Pitches | 147 |
| 0 | Games Started | 0 |
| 2 | Pinch At Bats | 0 |
| 0 | Pinch Hits | 0 |
| 0.0 | Player Rating | 0.0 |
| 1 | Is Qualified | 1 |
| 1 | Is Qualified In Steals | 1 |
| 5 | Total Bases | 16 |
| 34 | Plate Appearances | 38 |
| 0.0 | Projected Home Runs | 162.0 |
| 0 | Extra Base Hits | 5 |
| 0.2 | Runs Created | 7.2 |
| .161 | Batting Average | .300 |
| .000 | Pinch Hit Average | .000 |
| .161 | Slugging Percentage | .533 |
| .065 | Secondary Average | .500 |
| .235 | On Base Percentage | .378 |
| .397 | OBP Pct + SLG Pct | .912 |
| 1.1 | Ground To Fly Ball Ratio | 0.6 |
| 0.2 | Runs Created Per 27 Outs | 8.1 |
| 9.0 | Batter Rating | 55.0 |
| 0.0 | At Bats Per Home Run | 30.0 |
| 0.00 | Stolen Base Percentage | 1.00 |
| 3.50 | Pitches Per Plate Appearance | 3.87 |
| .000 | Isolated Power | .233 |
| 0.50 | Walk To Strikeout Ratio | 0.83 |
| .088 | Walks Per Plate Appearance | .132 |
| -.097 | Secondary Average Minus Batting Average | .200 |
| 2.0 | Runs Produced | 16.0 |
| 1.0 | Runs Ratio | 1.0 |
| 0.2 | Patience Ratio | 0.6 |
| 0.2 | Balls In Play Average | 0.3 |
| 63.5 | MLB Rating | 96.0 |
| 0.0 | Offensive Wins Above Replacement | 0.0 |
| 0.0 | Wins Above Replacement | 0.0 |
Game Information

Location: Arlington, Texas
Attendance: 28,138 | Capacity:
2025 National League Central Standings
| TEAM | W | L | PCT | GB | STRK |
|---|---|---|---|---|---|
 Chicago Chicago |
39 | 23 | .629 | - | W1 |
 St. Louis St. Louis |
34 | 28 | .548 | 5 | L1 |
 Milwaukee Milwaukee |
34 | 29 | .540 | 5.5 | W1 |
 Cincinnati Cincinnati |
30 | 33 | .476 | 9.5 | L1 |
 Pittsburgh Pittsburgh |
23 | 40 | .365 | 16.5 | L1 |
2025 American League West Standings
| TEAM | W | L | PCT | GB | STRK |
|---|---|---|---|---|---|
 Houston Houston |
34 | 28 | .548 | - | W1 |
 Seattle Seattle |
32 | 29 | .525 | 1.5 | L3 |
 Texas Texas |
29 | 34 | .460 | 5.5 | L3 |
 Los Angeles Los Angeles |
28 | 33 | .459 | 5.5 | L1 |
 Athletics Athletics |
24 | 40 | .375 | 11 | W1 |