
Baltimore Orioles at Seattle Mariners
· Major League Baseball
4 - 3

Rutschman and Henderson hit back-to-back homers and Orioles beat Mariners 4-3 for 3-game sweep

After the Orioles (25-36) played so poorly through mid-May that manager Brandon Hyde was fired after leading them to back-to-back playoff appearances, they looked like a contender against a strong Seattle squad.
Cal Raleigh hit his major league-leading 24th homer of the season for the Mariners, a two-run shot in the fifth that made it 3-1.
Rutschman tied it in the next inning when he lined an 0-2 pitch from Bryan Woo (5-3) to left for a two-run homer. Three pitches later, Henderson pounced on a fastball from Woo and drove it to over the wall in right.
Zach Eflin (5-2) allowed three runs on eight hits in six innings to win for the second time during the streak. The Orioles have allowed three runs or fewer in each of the six wins.
With closer Félix Bautista unavailable after finishing Baltimore's previous two victories at Seattle, Bryan Baker struck out two in a scoreless ninth for his second save.
Seattle was swept at home for the second time this season after Toronto did it last month.
Seattle right-hander Bryce Miller (2-4, 5.36) will start Friday night at the Los Angeles Angels.
How can I watch Baltimore Orioles vs. Seattle Mariners?
- TV Channel: Orioles at Mariners 2022 MLB Baseball, is broadcasted on MLB.TV.
- Online streaming: Sign up for Fubo.
Scoring Summary
 |
9th Inning | Moore struck out swinging. |
 |
9th Inning | Mastrobuoni singled to center. |
 |
9th Inning | Taveras struck out swinging. |
 |
9th Inning | Tellez flied out to left. |
 |
9th Inning | Baker relieved Kittredge |
 |
9th Inning | Adams flied out to right. |
Statistics
 BAL BAL |
 SEA SEA |
|
|---|---|---|
| 1 | Games Played | 1 |
| 1 | Team Games Played | 1 |
| 0 | Hit By Pitch | 0 |
| 10 | Ground Balls | 8 |
| 10 | Strikeouts | 12 |
| 3 | Runs Batted In | 3 |
| 0 | Sacrifice Hit | 0 |
| 6 | Hits | 9 |
| 0 | Stolen Bases | 1 |
| 2 | Walks | 0 |
| 0 | Catcher Interference | 0 |
| 4 | Runs | 3 |
| 0 | Ground Into Double Play | 0 |
| 0 | Sacrifice Flies | 0 |
| 33 | At Bats | 36 |
| 2 | Home Runs | 1 |
| 0 | Grand Slam Home Runs | 0 |
| 8 | Runners Left On Base | 13 |
| 0 | Triples | 0 |
| 1 | Game Winning RBIs | 0 |
| 0 | Intentional Walks | 0 |
| 1 | Doubles | 2 |
| 13 | Fly Balls | 16 |
| 0 | Caught Stealing | 0 |
| 138 | Pitches | 121 |
| 0 | Games Started | 0 |
| 0 | Pinch At Bats | 1 |
| 0 | Pinch Hits | 0 |
| 0.0 | Player Rating | 0.0 |
| 1 | Is Qualified | 1 |
| 0 | Is Qualified In Steals | 1 |
| 13 | Total Bases | 14 |
| 35 | Plate Appearances | 36 |
| 324.0 | Projected Home Runs | 162.0 |
| 3 | Extra Base Hits | 3 |
| 3.0 | Runs Created | 3.6 |
| .182 | Batting Average | .250 |
| .000 | Pinch Hit Average | .000 |
| .394 | Slugging Percentage | .389 |
| .273 | Secondary Average | .167 |
| .229 | On Base Percentage | .250 |
| .623 | OBP Pct + SLG Pct | .639 |
| 0.8 | Ground To Fly Ball Ratio | 0.5 |
| 3.0 | Runs Created Per 27 Outs | 3.6 |
| 28.0 | Batter Rating | 29.0 |
| 16.5 | At Bats Per Home Run | 36.0 |
| 0.00 | Stolen Base Percentage | 1.00 |
| 3.94 | Pitches Per Plate Appearance | 3.36 |
| .212 | Isolated Power | .139 |
| 0.20 | Walk To Strikeout Ratio | 0.00 |
| .057 | Walks Per Plate Appearance | .000 |
| .091 | Secondary Average Minus Batting Average | -.083 |
| 7.0 | Runs Produced | 6.0 |
| 0.8 | Runs Ratio | 1.0 |
| 0.4 | Patience Ratio | 0.4 |
| 0.2 | Balls In Play Average | 0.3 |
| 76.3 | MLB Rating | 78.5 |
| 0.0 | Offensive Wins Above Replacement | 0.0 |
| 0.0 | Wins Above Replacement | 0.0 |
Game Information
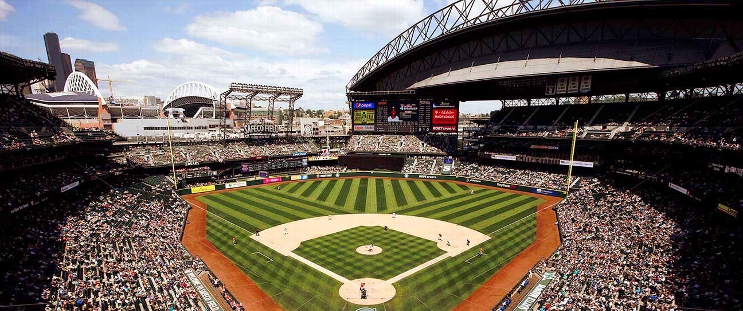
Location: Seattle, Washington
Attendance: 27,887 | Capacity:
2025 American League East Standings
| TEAM | W | L | PCT | GB | STRK |
|---|---|---|---|---|---|
 New York New York |
39 | 25 | .609 | - | L2 |
 Tampa Bay Tampa Bay |
36 | 30 | .545 | 4 | W2 |
 Toronto Toronto |
36 | 30 | .545 | 4 | W1 |
 Boston Boston |
32 | 36 | .471 | 9 | L1 |
 Baltimore Baltimore |
26 | 38 | .406 | 13 | L1 |
2025 American League West Standings
| TEAM | W | L | PCT | GB | STRK |
|---|---|---|---|---|---|
 Houston Houston |
36 | 29 | .554 | - | L1 |
 Seattle Seattle |
33 | 31 | .516 | 2.5 | W1 |
 Los Angeles Los Angeles |
31 | 34 | .477 | 5 | W1 |
 Texas Texas |
31 | 35 | .470 | 5.5 | W2 |
 Athletics Athletics |
26 | 42 | .382 | 11.5 | L1 |