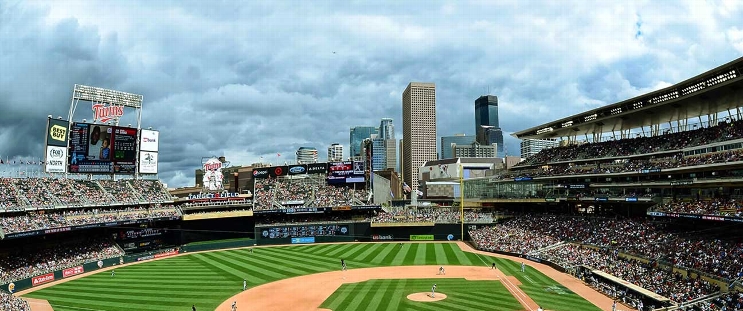
Seattle Mariners at Minnesota Twins
· Major League Baseball
1 - 10

Twins top Mariners 10-1 after spark from Woods Richardson's strong start and Larnach's homer

Brooks Lee led off an eight-run sixth against reliever Zach Pop with a home run. Then came RBI doubles from Byron Buxton and Willi Castro, a two-run single by Carlos Correa and a two-run homer from Matt Wallner in the highest-scoring inning for the Twins since a nine-run outburst in the first at New York on April 13, 2023.
Woods Richardson (3-4) produced a superb follow-up to the six scoreless innings Joe Ryan threw in a 2-0 victory on Wednesday, helping the Twins (39-42) win consecutive games for the first time since taking three straight from June 3-5. They lost 15 of 18 after that.
Emerson Hancock (3-4) started with four scoreless innings for the Mariners before Larnach's two-run shot in the fifth.
Mariners catcher Mitch Garver left in the fifth inning when Wallner fouled a ball off his mask, forcing star Cal Raleigh to finish behind the plate in forfeiture of the designated hitter.
The Twins start a three-game series at MLB-leading Detroit on Friday, considering an opener for RHP David Festa (1-2, 6.39) as they did during his last turn in the rotation. RHP Sawyer Gipson-Long (0-0, 4.58) will pitch for the Tigers.
How can I watch Seattle Mariners vs. Minnesota Twins?
- TV Channel: Mariners at Twins 2022 MLB Baseball, is broadcasted on MLBN.
- Online streaming: Sign up for Fubo.
Scoring Summary
 |
9th Inning | Young grounded out to pitcher. |
 |
9th Inning | Mastrobuoni reached on infield single to shortstop, Canzone scored, Solano to third. |
 |
9th Inning | Solano singled to center, Canzone to third. |
 |
9th Inning | Canzone singled to center. |
 |
9th Inning | Arozarena struck out looking. |
 |
9th Inning | Raleigh grounded out to second. |
Statistics
 SEA SEA |
 MIN MIN |
|
|---|---|---|
| 1 | Games Played | 1 |
| 1 | Team Games Played | 1 |
| 0 | Hit By Pitch | 2 |
| 15 | Ground Balls | 11 |
| 9 | Strikeouts | 3 |
| 1 | Runs Batted In | 10 |
| 0 | Sacrifice Hit | 0 |
| 6 | Hits | 11 |
| 0 | Stolen Bases | 0 |
| 2 | Walks | 7 |
| 0 | Catcher Interference | 0 |
| 1 | Runs | 10 |
| 0 | Ground Into Double Play | 0 |
| 0 | Sacrifice Flies | 0 |
| 33 | At Bats | 36 |
| 0 | Home Runs | 3 |
| 0 | Grand Slam Home Runs | 0 |
| 11 | Runners Left On Base | 19 |
| 0 | Triples | 0 |
| 0 | Game Winning RBIs | 1 |
| 0 | Intentional Walks | 0 |
| 2 | Doubles | 3 |
| 9 | Fly Balls | 22 |
| 0 | Caught Stealing | 0 |
| 150 | Pitches | 157 |
| 0 | Games Started | 0 |
| 1 | Pinch At Bats | 1 |
| 0 | Pinch Hits | 1 |
| 0.0 | Player Rating | 0.0 |
| 1 | Is Qualified | 1 |
| 0 | Is Qualified In Steals | 0 |
| 8 | Total Bases | 23 |
| 35 | Plate Appearances | 45 |
| 0.0 | Projected Home Runs | 486.0 |
| 2 | Extra Base Hits | 6 |
| 1.6 | Runs Created | 10.1 |
| .182 | Batting Average | .306 |
| .000 | Pinch Hit Average | 1.000 |
| .242 | Slugging Percentage | .639 |
| .121 | Secondary Average | .528 |
| .229 | On Base Percentage | .444 |
| .471 | OBP Pct + SLG Pct | 1.083 |
| 1.7 | Ground To Fly Ball Ratio | 0.5 |
| 1.6 | Runs Created Per 27 Outs | 11.0 |
| 14.0 | Batter Rating | 66.0 |
| 0.0 | At Bats Per Home Run | 12.0 |
| 0.00 | Stolen Base Percentage | 0.00 |
| 4.29 | Pitches Per Plate Appearance | 3.49 |
| .061 | Isolated Power | .333 |
| 0.22 | Walk To Strikeout Ratio | 2.33 |
| .057 | Walks Per Plate Appearance | .156 |
| -.061 | Secondary Average Minus Batting Average | .222 |
| 2.0 | Runs Produced | 20.0 |
| 1.0 | Runs Ratio | 1.0 |
| 0.3 | Patience Ratio | 0.8 |
| 0.3 | Balls In Play Average | 0.3 |
| 66.5 | MLB Rating | 108.3 |
| 0.0 | Offensive Wins Above Replacement | 0.0 |
| 0.0 | Wins Above Replacement | 0.0 |
Game Information

Location: Minneapolis, Minnesota
Attendance: 19,666 | Capacity:
2025 American League West Standings
| TEAM | W | L | PCT | GB | STRK |
|---|---|---|---|---|---|
 Houston Houston |
50 | 34 | .595 | - | W1 |
 Seattle Seattle |
43 | 40 | .518 | 6.5 | W1 |
 Los Angeles Los Angeles |
41 | 42 | .494 | 8.5 | L1 |
 Texas Texas |
41 | 43 | .488 | 9 | L1 |
 Athletics Athletics |
34 | 52 | .395 | 17 | L1 |
2025 American League Central Standings
| TEAM | W | L | PCT | GB | STRK |
|---|---|---|---|---|---|
 Detroit Detroit |
53 | 32 | .624 | - | W2 |
 Cleveland Cleveland |
40 | 42 | .488 | 11.5 | L4 |
 Minnesota Minnesota |
40 | 44 | .476 | 12.5 | L2 |
 Kansas City Kansas City |
39 | 45 | .464 | 13.5 | L1 |
 Chicago Chicago |
28 | 56 | .333 | 24.5 | W2 |