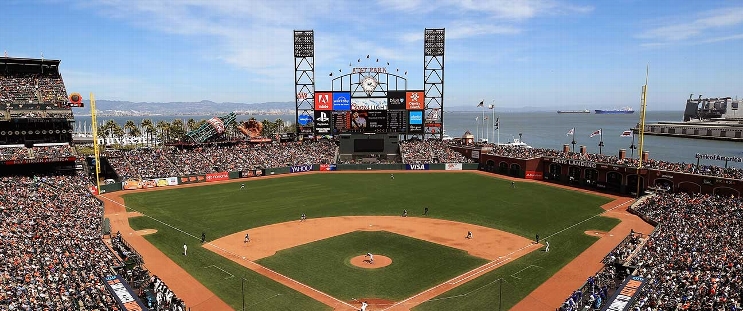
Miami Marlins at San Francisco Giants
· Major League Baseball
12 - 5

Stowers, Ramírez go deep as Marlins top Giants 12-5 to complete series sweep

Xavier Edwards had a two-run double for Miami, which has won four straight overall, five of six, and six straight on the road.
Rafael Devers had three hits including a homer and a double for San Francisco, which has lost eight of its last 11.
Devers’ homer was his 17th and his second in nine games since being acquired by San Francisco last week.
The Marlins broke a 5-5 tie in the fifth on Eric Wagaman's two-run double in a three-run inning.
Stowers hit a three-run homer in the first and Ramírez hit a two-run shot in the third — both off Giants starter Hayden Birdsong — to give Miami a 5-0 lead.
Devers hit a two-run homer in the bottom of the third, and the Giants tied it in the fourth when June Hoo Lee’s leadoff triple keyed a three-run inning.
Birdsong (3-2) allowed seven runs and four hits with four walks in four-plus innings.
Josh Simpson (1-0) got the last out of the fourth after Janson Junk allowed five runs and eight hits in 3 2/3 innings.
How can I watch Miami Marlins vs. San Francisco Giants?
- TV Channel: Marlins at Giants 2022 MLB Baseball, is broadcasted on MLB.TV.
- Online streaming: Sign up for Fubo.
Scoring Summary
 |
9th Inning | Flores fouled out to catcher. |
 |
9th Inning | Ramos struck out swinging. |
 |
9th Inning | Devers doubled to left. |
 |
9th Inning | Johnson grounded out to third. |
 |
9th Inning | Johnson hit for Yastrzemski |
 |
9th Inning | Fortes lined out to right. |
Statistics
 MIA MIA |
 SF SF |
|
|---|---|---|
| 1 | Games Played | 1 |
| 1 | Team Games Played | 1 |
| 1 | Hit By Pitch | 0 |
| 9 | Ground Balls | 10 |
| 8 | Strikeouts | 7 |
| 12 | Runs Batted In | 5 |
| 1 | Sacrifice Hit | 1 |
| 11 | Hits | 12 |
| 0 | Stolen Bases | 0 |
| 6 | Walks | 1 |
| 0 | Catcher Interference | 0 |
| 12 | Runs | 5 |
| 0 | Ground Into Double Play | 0 |
| 0 | Sacrifice Flies | 0 |
| 37 | At Bats | 38 |
| 2 | Home Runs | 1 |
| 0 | Grand Slam Home Runs | 0 |
| 14 | Runners Left On Base | 16 |
| 0 | Triples | 1 |
| 1 | Game Winning RBIs | 0 |
| 0 | Intentional Walks | 0 |
| 3 | Doubles | 3 |
| 21 | Fly Balls | 22 |
| 0 | Caught Stealing | 0 |
| 158 | Pitches | 154 |
| 0 | Games Started | 0 |
| 0 | Pinch At Bats | 1 |
| 0 | Pinch Hits | 0 |
| 0.0 | Player Rating | 0.0 |
| 1 | Is Qualified | 1 |
| 0 | Is Qualified In Steals | 0 |
| 20 | Total Bases | 20 |
| 45 | Plate Appearances | 40 |
| 324.0 | Projected Home Runs | 162.0 |
| 5 | Extra Base Hits | 5 |
| 8.4 | Runs Created | 6.6 |
| .297 | Batting Average | .316 |
| .000 | Pinch Hit Average | .000 |
| .541 | Slugging Percentage | .526 |
| .405 | Secondary Average | .237 |
| .409 | On Base Percentage | .333 |
| .950 | OBP Pct + SLG Pct | .860 |
| 0.4 | Ground To Fly Ball Ratio | 0.5 |
| 8.4 | Runs Created Per 27 Outs | 6.6 |
| 71.0 | Batter Rating | 43.5 |
| 18.5 | At Bats Per Home Run | 38.0 |
| 0.00 | Stolen Base Percentage | 0.00 |
| 3.51 | Pitches Per Plate Appearance | 3.85 |
| .243 | Isolated Power | .211 |
| 0.75 | Walk To Strikeout Ratio | 0.14 |
| .133 | Walks Per Plate Appearance | .025 |
| .108 | Secondary Average Minus Batting Average | -.079 |
| 24.0 | Runs Produced | 10.0 |
| 1.0 | Runs Ratio | 1.0 |
| 0.7 | Patience Ratio | 0.5 |
| 0.3 | Balls In Play Average | 0.4 |
| 107.5 | MLB Rating | 93.3 |
| 0.0 | Offensive Wins Above Replacement | 0.0 |
| 0.0 | Wins Above Replacement | 0.0 |
Game Information

Location: San Francisco, California
Attendance: 33,804 | Capacity:
2025 National League East Standings
| TEAM | W | L | PCT | GB | STRK |
|---|---|---|---|---|---|
 Philadelphia Philadelphia |
49 | 35 | .583 | - | W1 |
 New York New York |
48 | 37 | .565 | 1.5 | L3 |
 Atlanta Atlanta |
38 | 45 | .458 | 10.5 | L1 |
 Miami Miami |
37 | 45 | .451 | 11 | W7 |
 Washington Washington |
35 | 49 | .417 | 14 | W1 |
2025 National League West Standings
| TEAM | W | L | PCT | GB | STRK |
|---|---|---|---|---|---|
 Los Angeles Los Angeles |
53 | 32 | .624 | - | W1 |
 San Diego San Diego |
45 | 38 | .542 | 7 | L1 |
 San Francisco San Francisco |
45 | 39 | .536 | 7.5 | L2 |
 Arizona Arizona |
41 | 42 | .494 | 11 | L4 |
 Colorado Colorado |
19 | 65 | .226 | 33.5 | W1 |