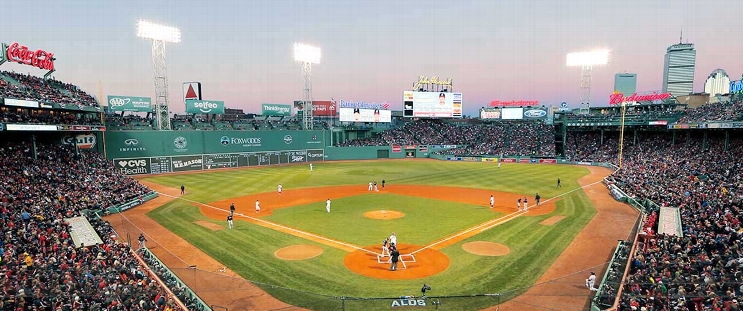
Toronto Blue Jays at Boston Red Sox
· Major League Baseball
9 - 0

José Berríos, Blue Jays bullpen keep Red Sox bats silent in 9-0 series-opening win

Bo Bichette, Alejandro Kirk, Ernie Clement and Andrés Giménez also drove in runs for Toronto, which has won six of eight meetings with its AL East rivals this season. Vladimir Guerrero Jr. added two hits.
Berríos (4-3) allowed just four hits and struck out eight and surrendered only one walk in handing Boston its sixth loss in a row.
Boston’s Brayan Bello (3-3) gave up three runs off eight hits over six innings with a strikeout. But he didn’t get support from a Red Sox lineup that has managed just four runs over their last three games. Boston was held to one run or none for the 15th time this season.
Boston opponents have scored at least eight runs four times over the last nine games — all Red Sox losses.
Guerrero Jr. was a late addition the the Blue Jays’ lineup. He left their series finale win over Cleveland on Thursday after being hit by a pitch in his right forearm. X-rays didn’t reveal a fracture, but manager John Schneider originally was going to be cautious and start Clement at first base.
How can I watch Toronto Blue Jays vs. Boston Red Sox?
- TV Channel: Blue Jays at Red Sox 2022 MLB Baseball, is broadcasted on MLB.TV.
- Online streaming: Sign up for Fubo.
Scoring Summary
 |
9th Inning | Eaton grounded out to third. |
 |
9th Inning | Toro popped out to shortstop. |
 |
9th Inning | Duran flied out to right. |
 |
9th Inning | Schultz relieved Sandlin |
 |
9th Inning | Clement at first base. |
 |
9th Inning | Roden in right field. |
Statistics
 TOR TOR |
 BOS BOS |
|
|---|---|---|
| 1 | Games Played | 1 |
| 1 | Team Games Played | 1 |
| 0 | Hit By Pitch | 0 |
| 17 | Ground Balls | 5 |
| 2 | Strikeouts | 8 |
| 9 | Runs Batted In | 0 |
| 0 | Sacrifice Hit | 0 |
| 16 | Hits | 4 |
| 2 | Stolen Bases | 0 |
| 8 | Walks | 2 |
| 0 | Catcher Interference | 0 |
| 9 | Runs | 0 |
| 1 | Ground Into Double Play | 3 |
| 1 | Sacrifice Flies | 0 |
| 40 | At Bats | 28 |
| 0 | Home Runs | 0 |
| 0 | Grand Slam Home Runs | 0 |
| 25 | Runners Left On Base | 10 |
| 0 | Triples | 0 |
| 1 | Game Winning RBIs | 0 |
| 1 | Intentional Walks | 0 |
| 3 | Doubles | 1 |
| 22 | Fly Balls | 15 |
| 0 | Caught Stealing | 0 |
| 188 | Pitches | 120 |
| 0 | Games Started | 0 |
| 2 | Pinch At Bats | 0 |
| 1 | Pinch Hits | 0 |
| 0.0 | Player Rating | 0.0 |
| 1 | Is Qualified | 1 |
| 1 | Is Qualified In Steals | 0 |
| 19 | Total Bases | 5 |
| 49 | Plate Appearances | 30 |
| 0.0 | Projected Home Runs | 0.0 |
| 3 | Extra Base Hits | 1 |
| 10.0 | Runs Created | -0.5 |
| .400 | Batting Average | .143 |
| .500 | Pinch Hit Average | .000 |
| .475 | Slugging Percentage | .179 |
| .325 | Secondary Average | .107 |
| .490 | On Base Percentage | .200 |
| .965 | OBP Pct + SLG Pct | .379 |
| 0.8 | Ground To Fly Ball Ratio | 0.3 |
| 10.4 | Runs Created Per 27 Outs | -0.5 |
| 60.0 | Batter Rating | 6.0 |
| 0.0 | At Bats Per Home Run | 0.0 |
| 1.00 | Stolen Base Percentage | 0.00 |
| 3.84 | Pitches Per Plate Appearance | 4.00 |
| .075 | Isolated Power | .036 |
| 4.00 | Walk To Strikeout Ratio | 0.25 |
| .163 | Walks Per Plate Appearance | .067 |
| -.075 | Secondary Average Minus Batting Average | -.036 |
| 18.0 | Runs Produced | 0.0 |
| 1.0 | Runs Ratio | 0.0 |
| 0.6 | Patience Ratio | 0.2 |
| 0.4 | Balls In Play Average | 0.2 |
| 108.3 | MLB Rating | 60.5 |
| 0.0 | Offensive Wins Above Replacement | 0.0 |
| 0.0 | Wins Above Replacement | 0.0 |
Game Information

Location: Boston, Massachusetts
Attendance: 35,719 | Capacity:
2025 American League East Standings
| TEAM | W | L | PCT | GB | STRK |
|---|---|---|---|---|---|
 Toronto Toronto |
49 | 38 | .563 | - | W5 |
 New York New York |
48 | 40 | .545 | 1.5 | L5 |
 Tampa Bay Tampa Bay |
48 | 40 | .545 | 1.5 | L1 |
 Boston Boston |
44 | 45 | .494 | 6 | W1 |
 Baltimore Baltimore |
37 | 49 | .430 | 11.5 | L2 |