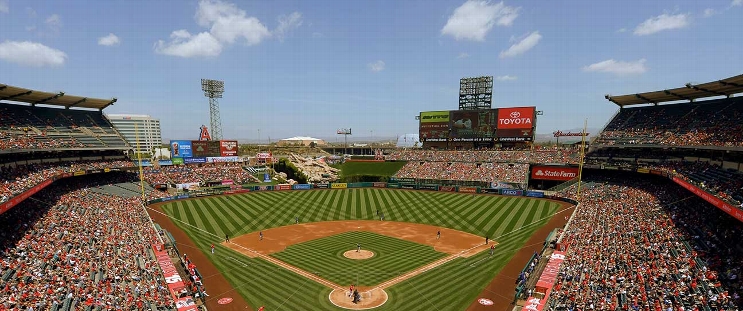
Washington Nationals at Los Angeles Angels
· Major League Baseball
15 - 9

Nationals set season highs for hits and runs in 15-9 win over Angels

CJ Abrams, Luis García Jr. and Nathaniel Lowe each had three hits for the Nationals. García and Lowe each had two RBI and reliever Brad Lord (2-5) gave up a hit over 1 2/3 scoreless innings.
Washington, which is just 6-18 in June, scored at least a run in each of the last five innings, capped by a four-run ninth.
Bell hit a two-run homer in the second inning before Young had a two-out, two-run double and scored on a single by Abrams, who was thrown out a second trying to stretch it into a double.
Lowe hit an RBI double and then scored on a single by Daylen Lile to give the Nationals an 8-7 lead in the fifth.
Taylor Ward, Nolan Schanuel and Jo Adell each homered for the Angels.
Reliever Sam Bachman (1-1) took the loss.
The Angels announced earlier Friday that manager Ron Washington would miss the rest of the season due to an unspecified medical issue. Ray Montgomery was named interim manager.
How can I watch Washington Nationals vs. Los Angeles Angels?
- TV Channel: Nationals at Angels 2022 MLB Baseball, is broadcasted on MLB.TV.
- Online streaming: Sign up for Fubo.
Scoring Summary
 |
9th Inning | Wade Jr. flied out to center. |
 |
9th Inning | O'Hoppe struck out swinging. |
 |
9th Inning | Adell lined out to center. |
 |
9th Inning | Brzykcy relieved Ferrer |
 |
9th Inning | Bell flied out to right. |
 |
9th Inning | Lowe flied out to right. |
Statistics
 WSH WSH |
 LAA LAA |
|
|---|---|---|
| 1 | Games Played | 1 |
| 1 | Team Games Played | 1 |
| 0 | Hit By Pitch | 0 |
| 17 | Ground Balls | 14 |
| 8 | Strikeouts | 7 |
| 15 | Runs Batted In | 8 |
| 0 | Sacrifice Hit | 0 |
| 19 | Hits | 11 |
| 3 | Stolen Bases | 0 |
| 6 | Walks | 6 |
| 0 | Catcher Interference | 0 |
| 15 | Runs | 9 |
| 0 | Ground Into Double Play | 2 |
| 1 | Sacrifice Flies | 0 |
| 43 | At Bats | 37 |
| 1 | Home Runs | 3 |
| 0 | Grand Slam Home Runs | 0 |
| 24 | Runners Left On Base | 22 |
| 0 | Triples | 0 |
| 1 | Game Winning RBIs | 0 |
| 1 | Intentional Walks | 0 |
| 5 | Doubles | 3 |
| 19 | Fly Balls | 16 |
| 1 | Caught Stealing | 0 |
| 178 | Pitches | 163 |
| 0 | Games Started | 0 |
| 0 | Pinch At Bats | 1 |
| 0 | Pinch Hits | 0 |
| 0.0 | Player Rating | 0.0 |
| 1 | Is Qualified | 1 |
| 1 | Is Qualified In Steals | 0 |
| 27 | Total Bases | 23 |
| 50 | Plate Appearances | 43 |
| 162.0 | Projected Home Runs | 486.0 |
| 6 | Extra Base Hits | 6 |
| 12.8 | Runs Created | 8.1 |
| .442 | Batting Average | .297 |
| .000 | Pinch Hit Average | .000 |
| .628 | Slugging Percentage | .622 |
| .372 | Secondary Average | .486 |
| .500 | On Base Percentage | .395 |
| 1.128 | OBP Pct + SLG Pct | 1.017 |
| 0.9 | Ground To Fly Ball Ratio | 0.9 |
| 13.3 | Runs Created Per 27 Outs | 7.8 |
| 95.0 | Batter Rating | 60.0 |
| 43.0 | At Bats Per Home Run | 12.3 |
| 0.75 | Stolen Base Percentage | 0.00 |
| 3.56 | Pitches Per Plate Appearance | 3.79 |
| .186 | Isolated Power | .324 |
| 0.75 | Walk To Strikeout Ratio | 0.86 |
| .120 | Walks Per Plate Appearance | .140 |
| -.070 | Secondary Average Minus Batting Average | .189 |
| 30.0 | Runs Produced | 17.0 |
| 1.0 | Runs Ratio | 0.9 |
| 0.7 | Patience Ratio | 0.7 |
| 0.5 | Balls In Play Average | 0.3 |
| 129.3 | MLB Rating | 103.3 |
| 0.0 | Offensive Wins Above Replacement | 0.0 |
| 0.0 | Wins Above Replacement | 0.0 |
Game Information

Location: Anaheim, California
Attendance: 34,289 | Capacity:
2025 National League East Standings
| TEAM | W | L | PCT | GB | STRK |
|---|---|---|---|---|---|
 Philadelphia Philadelphia |
51 | 36 | .586 | - | W1 |
 New York New York |
50 | 38 | .568 | 1.5 | W2 |
 Miami Miami |
39 | 46 | .459 | 11 | W1 |
 Atlanta Atlanta |
39 | 47 | .453 | 11.5 | L1 |
 Washington Washington |
37 | 50 | .425 | 14 | W2 |
2025 American League West Standings
| TEAM | W | L | PCT | GB | STRK |
|---|---|---|---|---|---|
 Houston Houston |
52 | 35 | .598 | - | L1 |
 Seattle Seattle |
45 | 42 | .517 | 7 | L1 |
 Los Angeles Los Angeles |
43 | 43 | .500 | 8.5 | W1 |
 Texas Texas |
43 | 44 | .494 | 9 | W2 |
 Athletics Athletics |
36 | 53 | .404 | 17 | L1 |