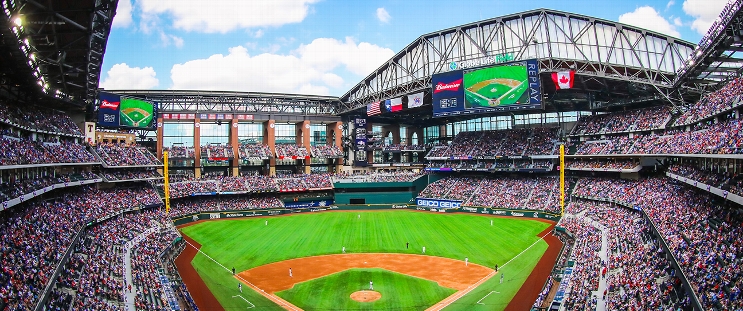
Seattle Mariners at Texas Rangers
· Major League Baseball
6 - 4

Mitch Garver and Mariners beat Rangers in 12 as all 3 games of series go extra innings

The Mariners took a 3-1 lead in the 10th on RBI singles by Donovan Solano and Garver, but Corey Seager's two-run shot pulled the Rangers even. The Mariners won the series opener 7-6 in 12 before dropping the middle game 3-2 in 10.
It was the first time three games in the same series for Texas went to extra innings since all four at Seattle in September 2002. The Mariners won the first three games of that series before the Rangers took the finale.
Seattle played three straight extra-inning games for the second time this season. The Mariners are 6-7 in extra-inning games, one behind Boston for most in the majors.
Solano put Seattle ahead 4-3 in the 12th on a groundout that third baseman Josh Jung couldn't get out of his glove, allowing automatic runner Luke Raley to score. On the next pitch from Cole Winn (0-1), Garver's fourth homer went 437 feet into the second deck in left field.
Seager's tying homer was his 10th, an opposite field shot to left center off Carlos Vargas.
Trent Thornton (2-0) gave up Seager's sacrifice fly in the 12th, striking out two in his two innings.
This story has been corrected to show that Seager's sacrifice fly was in the 12th inning. A previous version stated that it was in the 10th.
How can I watch Seattle Mariners vs. Texas Rangers?
- TV Channel: Mariners at Rangers 2022 MLB Baseball, is broadcasted on MLB.TV.
- Online streaming: Sign up for Fubo.
Scoring Summary
 |
12th Inning | Semien popped out to shortstop. |
 |
12th Inning | Seager hit sacrifice fly to left, Higashioka scored. |
 |
12th Inning | Smith grounded out to shortstop, Higashioka to third. |
 |
12th Inning | Williamson grounded out to third. |
 |
12th Inning | Young popped out to third. |
 |
12th Inning | Garver homered to left center (437 feet), Arozarena scored. |
Statistics
 SEA SEA |
 TEX TEX |
|
|---|---|---|
| 1 | Games Played | 1 |
| 1 | Team Games Played | 1 |
| 0 | Hit By Pitch | 0 |
| 0 | Ground Balls | 0 |
| 12 | Strikeouts | 9 |
| 6 | Runs Batted In | 4 |
| 2 | Sacrifice Hit | 1 |
| 13 | Hits | 9 |
| 0 | Stolen Bases | 3 |
| 5 | Walks | 4 |
| 0 | Catcher Interference | 0 |
| 6 | Runs | 4 |
| 0 | Ground Into Double Play | 1 |
| 0 | Sacrifice Flies | 1 |
| 47 | At Bats | 42 |
| 1 | Home Runs | 1 |
| 0 | Grand Slam Home Runs | 0 |
| 24 | Runners Left On Base | 25 |
| 0 | Triples | 0 |
| 0 | Game Winning RBIs | 0 |
| 4 | Intentional Walks | 2 |
| 1 | Doubles | 1 |
| 0 | Fly Balls | 0 |
| 0 | Caught Stealing | 0 |
| 167 | Pitches | 193 |
| 0 | Games Started | 0 |
| 0 | Pinch At Bats | 0 |
| 0 | Pinch Hits | 0 |
| 0.0 | Player Rating | 0.0 |
| 1 | Is Qualified | 1 |
| 0 | Is Qualified In Steals | 1 |
| 17 | Total Bases | 13 |
| 54 | Plate Appearances | 48 |
| 162.0 | Projected Home Runs | 162.0 |
| 2 | Extra Base Hits | 2 |
| 6.4 | Runs Created | 4.1 |
| .277 | Batting Average | .214 |
| .000 | Pinch Hit Average | .000 |
| .362 | Slugging Percentage | .310 |
| .191 | Secondary Average | .262 |
| .346 | On Base Percentage | .277 |
| .708 | OBP Pct + SLG Pct | .586 |
| 0.0 | Ground To Fly Ball Ratio | 0.0 |
| 4.8 | Runs Created Per 27 Outs | 3.1 |
| 42.0 | Batter Rating | 33.0 |
| 47.0 | At Bats Per Home Run | 42.0 |
| 0.00 | Stolen Base Percentage | 1.00 |
| 3.09 | Pitches Per Plate Appearance | 4.02 |
| .085 | Isolated Power | .095 |
| 0.42 | Walk To Strikeout Ratio | 0.44 |
| .093 | Walks Per Plate Appearance | .083 |
| -.085 | Secondary Average Minus Batting Average | .048 |
| 12.0 | Runs Produced | 8.0 |
| 1.0 | Runs Ratio | 1.0 |
| 0.4 | Patience Ratio | 0.4 |
| 0.4 | Balls In Play Average | 0.3 |
| 91.3 | MLB Rating | 80.8 |
| 0.0 | Offensive Wins Above Replacement | 0.0 |
| 0.0 | Wins Above Replacement | 0.0 |
Game Information

Location: Arlington, Texas
Attendance: 31,126 | Capacity:
2025 American League West Standings
| TEAM | W | L | PCT | GB | STRK |
|---|---|---|---|---|---|
 Houston Houston |
50 | 34 | .595 | - | W1 |
 Seattle Seattle |
43 | 40 | .518 | 6.5 | W1 |
 Los Angeles Los Angeles |
41 | 42 | .494 | 8.5 | L1 |
 Texas Texas |
41 | 43 | .488 | 9 | L1 |
 Athletics Athletics |
34 | 52 | .395 | 17 | L1 |