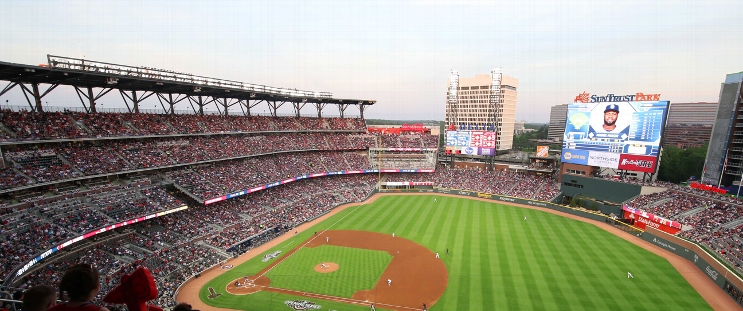
Los Angeles Angels at Atlanta Braves
· Major League Baseball
4 - 0

Adell's double in 8th drives in the game's first run as Angels beat Braves 4-0 and return to .500

The Angels (42-42) reached .500 for the ninth time this season, while the Braves (38-46) have lost five of six.
Adell's double down the left-field line off Dylan Lee (1-3) drove in Mike Trout, who doubled. Jorge Soler, who came off the injured list after missing 11 games with lower back inflammation, added a two-run double off Enyel De Los Santos in the four-run inning.
Angels shortstop Zach Neto returned as the leadoff hitter after missing four starts with a jammed right shoulder.
“Having the two guys back makes a huge difference,” interim manager Ray Montgomery said before the game.
The refurbished lineup struggled against Atlanta right-hander Grant Holmes, who allowed only three hits and recorded 10 strikeouts in six innings. Angels left-hander Tyler Anderson also threw six scoreless innings with seven strikeouts.
Rookie right-hander José Fermin (1-0) earned his first win with a scoreless seventh.
How can I watch Los Angeles Angels vs. Atlanta Braves?
- TV Channel: Angels at Braves 2022 MLB Baseball, is broadcasted on MLB.TV.
- Online streaming: Sign up for Fubo.
Scoring Summary
 |
9th Inning | Murphy struck out swinging. |
 |
9th Inning | Albies to second on fielder's indifference. |
 |
9th Inning | Murphy hit for Allen |
 |
9th Inning | Harris II struck out swinging. |
 |
9th Inning | Verdugo flied out to center. |
 |
9th Inning | Albies singled to right. |
Statistics
 LAA LAA |
 ATL ATL |
|
|---|---|---|
| 1 | Games Played | 1 |
| 1 | Team Games Played | 1 |
| 1 | Hit By Pitch | 0 |
| 8 | Ground Balls | 8 |
| 10 | Strikeouts | 11 |
| 4 | Runs Batted In | 0 |
| 0 | Sacrifice Hit | 0 |
| 8 | Hits | 7 |
| 0 | Stolen Bases | 0 |
| 7 | Walks | 2 |
| 0 | Catcher Interference | 0 |
| 4 | Runs | 0 |
| 0 | Ground Into Double Play | 0 |
| 0 | Sacrifice Flies | 0 |
| 35 | At Bats | 34 |
| 0 | Home Runs | 0 |
| 0 | Grand Slam Home Runs | 0 |
| 21 | Runners Left On Base | 17 |
| 0 | Triples | 1 |
| 1 | Game Winning RBIs | 0 |
| 0 | Intentional Walks | 1 |
| 3 | Doubles | 1 |
| 17 | Fly Balls | 15 |
| 0 | Caught Stealing | 0 |
| 194 | Pitches | 133 |
| 0 | Games Started | 0 |
| 0 | Pinch At Bats | 1 |
| 0 | Pinch Hits | 0 |
| 0.0 | Player Rating | 0.0 |
| 1 | Is Qualified | 1 |
| 0 | Is Qualified In Steals | 0 |
| 11 | Total Bases | 10 |
| 43 | Plate Appearances | 36 |
| 0.0 | Projected Home Runs | 0.0 |
| 3 | Extra Base Hits | 2 |
| 5.0 | Runs Created | 2.4 |
| .229 | Batting Average | .206 |
| .000 | Pinch Hit Average | .000 |
| .314 | Slugging Percentage | .294 |
| .286 | Secondary Average | .147 |
| .372 | On Base Percentage | .250 |
| .686 | OBP Pct + SLG Pct | .544 |
| 0.5 | Ground To Fly Ball Ratio | 0.5 |
| 5.0 | Runs Created Per 27 Outs | 2.4 |
| 30.0 | Batter Rating | 11.5 |
| 0.0 | At Bats Per Home Run | 0.0 |
| 0.00 | Stolen Base Percentage | 0.00 |
| 4.51 | Pitches Per Plate Appearance | 3.69 |
| .086 | Isolated Power | .088 |
| 0.70 | Walk To Strikeout Ratio | 0.18 |
| .163 | Walks Per Plate Appearance | .056 |
| .057 | Secondary Average Minus Batting Average | -.059 |
| 8.0 | Runs Produced | 0.0 |
| 1.0 | Runs Ratio | 0.0 |
| 0.5 | Patience Ratio | 0.3 |
| 0.3 | Balls In Play Average | 0.3 |
| 78.8 | MLB Rating | 67.0 |
| 0.0 | Offensive Wins Above Replacement | 0.0 |
| 0.0 | Wins Above Replacement | 0.0 |
Game Information

Location: Atlanta, Georgia
Attendance: 31,657 | Capacity:
2025 American League West Standings
| TEAM | W | L | PCT | GB | STRK |
|---|---|---|---|---|---|
 Houston Houston |
52 | 35 | .598 | - | L1 |
 Seattle Seattle |
45 | 42 | .517 | 7 | L1 |
 Los Angeles Los Angeles |
43 | 43 | .500 | 8.5 | W1 |
 Texas Texas |
43 | 44 | .494 | 9 | W2 |
 Athletics Athletics |
36 | 53 | .404 | 17 | L1 |
2025 National League East Standings
| TEAM | W | L | PCT | GB | STRK |
|---|---|---|---|---|---|
 Philadelphia Philadelphia |
51 | 36 | .586 | - | W1 |
 New York New York |
50 | 38 | .568 | 1.5 | W2 |
 Miami Miami |
39 | 46 | .459 | 11 | W1 |
 Atlanta Atlanta |
39 | 47 | .453 | 11.5 | L1 |
 Washington Washington |
37 | 51 | .420 | 14.5 | L1 |