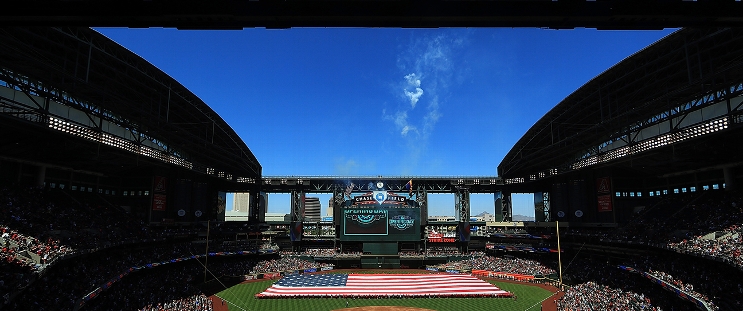
San Francisco Giants at Arizona Diamondbacks
· Major League Baseball
2 - 8

McCarthy, Gurriel go deep as D-backs hit 4 homers in 8-2 win over the sliding Giants

Right-hander Zac Gallen (6-9) struck out 10 over seven strong innings, giving up just one earned run and bouncing back from a mediocre stretch of outings.
Randal Grichuk and James McCann added back-to-back solo homers in the sixth to push the D-backs lead to 8-2.
San Francisco has lost seven of its past eight games.
The D-backs took a 4-2 lead in the fourth after Eugenio Suarez and Lourdes Gurriel Jr. drew back-to-back walks from Hayden Birdsong to start the inning. McCarthy — who recently returned to the big leagues after spending most of the season at Triple-A Reno — followed with the no-doubt shot into the right field seats.
Birdsong (3-3) gave up four runs, including three earned, over four innings. The right-hander struck out six.
The Giants took an early 2-0 lead on a Willy Adames solo homer and Patrick Bailey's RBI groundout. The D-backs cut the advantage to 2-1 in the third on Geraldo Perdomo's RBI single.
In the fifth, Bailey's second passed ball allowed Suarez to reach first on a strikeout with two outs. Gurriel followed with his two-run homer.
How can I watch San Francisco Giants vs. Arizona Diamondbacks?
- TV Channel: Giants at Diamondbacks 2022 MLB Baseball, is broadcasted on MLB.TV.
- Online streaming: Sign up for Fubo.
Scoring Summary
 |
9th Inning | Smith grounded out to second. |
 |
9th Inning | Flores lined out to first. |
 |
9th Inning | Devers struck out swinging. |
 |
9th Inning | Matos hit a ground rule double. |
 |
8th Inning | Perdomo struck out swinging. |
 |
8th Inning | Thomas singled to center, Thomas to second, McCann to third. |
Statistics
 SF SF |
 ARI ARI |
|
|---|---|---|
| 1 | Games Played | 1 |
| 1 | Team Games Played | 1 |
| 0 | Hit By Pitch | 0 |
| 7 | Ground Balls | 8 |
| 12 | Strikeouts | 11 |
| 2 | Runs Batted In | 8 |
| 0 | Sacrifice Hit | 0 |
| 6 | Hits | 9 |
| 1 | Stolen Bases | 0 |
| 0 | Walks | 5 |
| 0 | Catcher Interference | 0 |
| 2 | Runs | 8 |
| 0 | Ground Into Double Play | 2 |
| 0 | Sacrifice Flies | 0 |
| 32 | At Bats | 32 |
| 1 | Home Runs | 4 |
| 0 | Grand Slam Home Runs | 0 |
| 6 | Runners Left On Base | 10 |
| 0 | Triples | 0 |
| 0 | Game Winning RBIs | 1 |
| 0 | Intentional Walks | 0 |
| 3 | Doubles | 1 |
| 13 | Fly Balls | 13 |
| 0 | Caught Stealing | 0 |
| 126 | Pitches | 153 |
| 0 | Games Started | 0 |
| 0 | Pinch At Bats | 0 |
| 0 | Pinch Hits | 0 |
| 0.0 | Player Rating | 0.0 |
| 1 | Is Qualified | 1 |
| 1 | Is Qualified In Steals | 0 |
| 12 | Total Bases | 22 |
| 32 | Plate Appearances | 37 |
| 162.0 | Projected Home Runs | 648.0 |
| 4 | Extra Base Hits | 5 |
| 2.3 | Runs Created | 7.3 |
| .188 | Batting Average | .281 |
| .000 | Pinch Hit Average | .000 |
| .375 | Slugging Percentage | .688 |
| .219 | Secondary Average | .563 |
| .188 | On Base Percentage | .378 |
| .563 | OBP Pct + SLG Pct | 1.066 |
| 0.5 | Ground To Fly Ball Ratio | 0.6 |
| 2.4 | Runs Created Per 27 Outs | 7.8 |
| 24.0 | Batter Rating | 55.0 |
| 32.0 | At Bats Per Home Run | 8.0 |
| 1.00 | Stolen Base Percentage | 0.00 |
| 3.94 | Pitches Per Plate Appearance | 4.14 |
| .188 | Isolated Power | .406 |
| 0.00 | Walk To Strikeout Ratio | 0.45 |
| .000 | Walks Per Plate Appearance | .135 |
| .031 | Secondary Average Minus Batting Average | .281 |
| 4.0 | Runs Produced | 16.0 |
| 1.0 | Runs Ratio | 1.0 |
| 0.4 | Patience Ratio | 0.8 |
| 0.3 | Balls In Play Average | 0.3 |
| 71.8 | MLB Rating | 98.8 |
| 0.0 | Offensive Wins Above Replacement | 0.0 |
| 0.0 | Wins Above Replacement | 0.0 |
Game Information

Location: Phoenix, Arizona
Attendance: 19,455 | Capacity:
2025 National League West Standings
| TEAM | W | L | PCT | GB | STRK |
|---|---|---|---|---|---|
 Los Angeles Los Angeles |
56 | 32 | .636 | - | W4 |
 San Diego San Diego |
46 | 40 | .535 | 9 | L1 |
 San Francisco San Francisco |
47 | 41 | .534 | 9 | W2 |
 Arizona Arizona |
43 | 44 | .494 | 12.5 | L2 |
 Colorado Colorado |
20 | 67 | .230 | 35.5 | W1 |