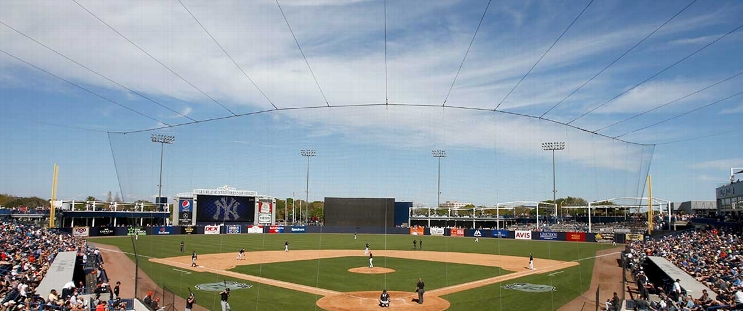
Athletics at Tampa Bay Rays
· Major League Baseball
5 - 6

Rays get 3 homers, strong start from Pepiot to avoid sweep with 6-5 win over Athletics

Trailing 2-1 entering the bottom of the sixth, the Rays batted around and scored five runs. Lowe’s leadoff shot tied the contest, Brandon Lowe followed with a double to extend his major-league leading hitting streak to 18 games and Díaz put Tampa Bay ahead with a two-run homer.
Pepiot (6-6) pitched six innings, allowing four hits and two runs — on Brent Rooker and Max Schuemann solo homers — walking three with nine strikeouts. He fanned five of his last six batters.
Mangum got the Rays on the board with an inside-the-park homer, crushing a slider to the deepest part of the park, just out of reach of center fielder Denzel Clarke. The first such homer by a Rays player in two years, it was the 24th in franchise history.
Max Muncy also homered for the A’s, which got three hits from Schuemann. Second baseman Luis Urías departed in the sixth with right hamstring tightness.
How can I watch Athletics vs. Tampa Bay Rays?
- TV Channel: Athletics at Rays 2022 MLB Baseball, is broadcasted on MLB.TV.
- Online streaming: Sign up for Fubo.
Scoring Summary
 |
9th Inning | Kurtz struck out swinging. |
 |
9th Inning | Rooker struck out swinging. |
 |
9th Inning | Soderstrom reached on infield single to first, Urshela scored, Butler to second, Schuemann to third. |
 |
9th Inning | Butler singled to right, Schuemann to second, Urshela to third. |
 |
9th Inning | Butler hit for Clarke |
 |
9th Inning | Schuemann singled to left, Urshela to second. |
Statistics
 ATH ATH |
 TB TB |
|
|---|---|---|
| 1 | Games Played | 1 |
| 1 | Team Games Played | 1 |
| 0 | Hit By Pitch | 0 |
| 9 | Ground Balls | 11 |
| 17 | Strikeouts | 7 |
| 5 | Runs Batted In | 6 |
| 1 | Sacrifice Hit | 0 |
| 10 | Hits | 10 |
| 1 | Stolen Bases | 1 |
| 3 | Walks | 0 |
| 0 | Catcher Interference | 0 |
| 5 | Runs | 6 |
| 1 | Ground Into Double Play | 1 |
| 0 | Sacrifice Flies | 0 |
| 36 | At Bats | 33 |
| 3 | Home Runs | 3 |
| 0 | Grand Slam Home Runs | 0 |
| 14 | Runners Left On Base | 6 |
| 0 | Triples | 0 |
| 0 | Game Winning RBIs | 1 |
| 0 | Intentional Walks | 0 |
| 1 | Doubles | 2 |
| 11 | Fly Balls | 15 |
| 0 | Caught Stealing | 0 |
| 156 | Pitches | 118 |
| 0 | Games Started | 0 |
| 1 | Pinch At Bats | 0 |
| 1 | Pinch Hits | 0 |
| 0.0 | Player Rating | 0.0 |
| 1 | Is Qualified | 1 |
| 1 | Is Qualified In Steals | 1 |
| 20 | Total Bases | 21 |
| 40 | Plate Appearances | 33 |
| 486.0 | Projected Home Runs | 486.0 |
| 4 | Extra Base Hits | 5 |
| 6.4 | Runs Created | 6.1 |
| .278 | Batting Average | .303 |
| 1.000 | Pinch Hit Average | .000 |
| .556 | Slugging Percentage | .636 |
| .389 | Secondary Average | .364 |
| .333 | On Base Percentage | .303 |
| .889 | OBP Pct + SLG Pct | .939 |
| 0.8 | Ground To Fly Ball Ratio | 0.7 |
| 6.2 | Runs Created Per 27 Outs | 6.8 |
| 42.0 | Batter Rating | 48.0 |
| 12.0 | At Bats Per Home Run | 11.0 |
| 1.00 | Stolen Base Percentage | 1.00 |
| 3.90 | Pitches Per Plate Appearance | 3.58 |
| .278 | Isolated Power | .333 |
| 0.18 | Walk To Strikeout Ratio | 0.00 |
| .075 | Walks Per Plate Appearance | .000 |
| .111 | Secondary Average Minus Batting Average | .061 |
| 10.0 | Runs Produced | 12.0 |
| 1.0 | Runs Ratio | 1.0 |
| 0.6 | Patience Ratio | 0.6 |
| 0.4 | Balls In Play Average | 0.3 |
| 89.5 | MLB Rating | 94.8 |
| 0.0 | Offensive Wins Above Replacement | 0.0 |
| 0.0 | Wins Above Replacement | 0.0 |
Game Information

Location: Tampa, Florida
Attendance: 10,046 | Capacity:
2025 American League West Standings
| TEAM | W | L | PCT | GB | STRK |
|---|---|---|---|---|---|
 Houston Houston |
52 | 35 | .598 | - | L1 |
 Seattle Seattle |
45 | 42 | .517 | 7 | L1 |
 Los Angeles Los Angeles |
43 | 43 | .500 | 8.5 | W1 |
 Texas Texas |
43 | 44 | .494 | 9 | W2 |
 Athletics Athletics |
36 | 53 | .404 | 17 | L1 |
2025 American League East Standings
| TEAM | W | L | PCT | GB | STRK |
|---|---|---|---|---|---|
 Toronto Toronto |
49 | 38 | .563 | - | W5 |
 New York New York |
48 | 39 | .552 | 1 | L4 |
 Tampa Bay Tampa Bay |
48 | 39 | .552 | 1 | W1 |
 Boston Boston |
43 | 45 | .489 | 6.5 | L1 |
 Baltimore Baltimore |
37 | 49 | .430 | 11.5 | L2 |