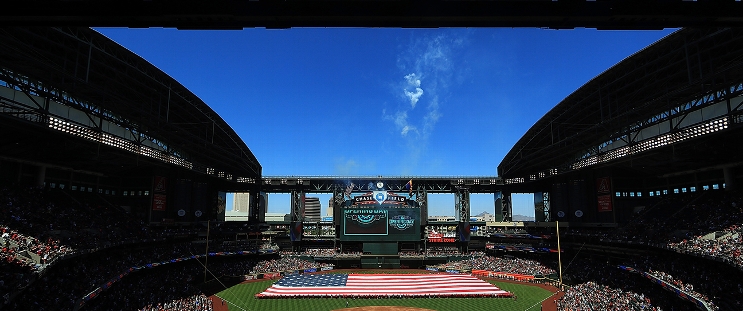
San Francisco Giants at Arizona Diamondbacks
· Major League Baseball
6 - 5

Bailey hits sacrifice fly in 10th to lift Giants over D-backs and snap 4-game losing streak

The Giants led 5-3 heading into the ninth, but Geraldo Perdomo led off with a single and then Ketel Marte — who was named a National League All-Star starter at second base earlier in the day — launched a tying homer to right off Camilo Doval for his 18th long ball of the season.
San Francisco retook the lead in the 10th on Bailey's fly ball to center after Lee advanced to third on an infield single by Heliot Ramos. Doval (4-2) worked the bottom of the 10th for the win.
San Francisco's Mike Yastrzemski went deep on the second pitch of the game, driving a fastball into the right field seats. Lee's triple drove home Wilmer Flores to make it 2-0 in the first.
The Giants pushed their advantage to 3-0 in the fifth on Rafael Devers' RBI single.
Alek Thomas hit a leadoff homer to cut the deficit to 3-1 and the next three batters reached base against Landen Roupp with no outs. Lefty Erik Miller did an admirable job getting out of the jam, allowing Josh Naylor's sacrifice fly but perserving a 3-2 lead.
Arizona's Merrill Kelly gave up three runs on five hits and three walks over six innings. The right-hander struck out three.
How can I watch San Francisco Giants vs. Arizona Diamondbacks?
- TV Channel: Giants at Diamondbacks 2022 MLB Baseball, is broadcasted on MLB.TV.
- Online streaming: Sign up for Fubo.
Scoring Summary
 |
10th Inning | Thomas struck out swinging. |
 |
10th Inning | McCarthy struck out swinging. |
 |
10th Inning | Gurriel Jr. flied out to center, Alexander to third. |
 |
10th Inning | Wisely at second base. |
 |
10th Inning | Smith at first base. |
 |
10th Inning | Ramos in left field. |
Statistics
 SF SF |
 ARI ARI |
|
|---|---|---|
| 1 | Games Played | 1 |
| 1 | Team Games Played | 1 |
| 0 | Hit By Pitch | 0 |
| 11 | Ground Balls | 10 |
| 5 | Strikeouts | 13 |
| 6 | Runs Batted In | 5 |
| 0 | Sacrifice Hit | 0 |
| 10 | Hits | 11 |
| 0 | Stolen Bases | 0 |
| 5 | Walks | 5 |
| 0 | Catcher Interference | 0 |
| 6 | Runs | 5 |
| 1 | Ground Into Double Play | 2 |
| 1 | Sacrifice Flies | 1 |
| 38 | At Bats | 38 |
| 1 | Home Runs | 2 |
| 0 | Grand Slam Home Runs | 0 |
| 19 | Runners Left On Base | 26 |
| 1 | Triples | 0 |
| 1 | Game Winning RBIs | 0 |
| 0 | Intentional Walks | 0 |
| 2 | Doubles | 1 |
| 23 | Fly Balls | 16 |
| 0 | Caught Stealing | 0 |
| 172 | Pitches | 164 |
| 0 | Games Started | 0 |
| 2 | Pinch At Bats | 2 |
| 1 | Pinch Hits | 0 |
| 0.0 | Player Rating | 0.0 |
| 1 | Is Qualified | 1 |
| 0 | Is Qualified In Steals | 0 |
| 17 | Total Bases | 18 |
| 44 | Plate Appearances | 44 |
| 162.0 | Projected Home Runs | 324.0 |
| 4 | Extra Base Hits | 3 |
| 5.9 | Runs Created | 6.1 |
| .263 | Batting Average | .289 |
| .500 | Pinch Hit Average | .000 |
| .447 | Slugging Percentage | .474 |
| .316 | Secondary Average | .316 |
| .341 | On Base Percentage | .364 |
| .788 | OBP Pct + SLG Pct | .837 |
| 0.5 | Ground To Fly Ball Ratio | 0.6 |
| 5.3 | Runs Created Per 27 Outs | 5.5 |
| 43.5 | Batter Rating | 39.0 |
| 38.0 | At Bats Per Home Run | 19.0 |
| 0.00 | Stolen Base Percentage | 0.00 |
| 3.91 | Pitches Per Plate Appearance | 3.73 |
| .184 | Isolated Power | .184 |
| 1.00 | Walk To Strikeout Ratio | 0.38 |
| .114 | Walks Per Plate Appearance | .114 |
| .053 | Secondary Average Minus Batting Average | .026 |
| 12.0 | Runs Produced | 10.0 |
| 1.0 | Runs Ratio | 1.0 |
| 0.5 | Patience Ratio | 0.5 |
| 0.3 | Balls In Play Average | 0.4 |
| 91.3 | MLB Rating | 89.5 |
| 0.0 | Offensive Wins Above Replacement | 0.0 |
| 0.0 | Wins Above Replacement | 0.0 |
Game Information

Location: Phoenix, Arizona
Attendance: 17,840 | Capacity:
2025 National League West Standings
| TEAM | W | L | PCT | GB | STRK |
|---|---|---|---|---|---|
 Los Angeles Los Angeles |
56 | 32 | .636 | - | W4 |
 San Diego San Diego |
46 | 40 | .535 | 9 | L1 |
 San Francisco San Francisco |
47 | 41 | .534 | 9 | W2 |
 Arizona Arizona |
43 | 44 | .494 | 12.5 | L2 |
 Colorado Colorado |
20 | 67 | .230 | 35.5 | W1 |