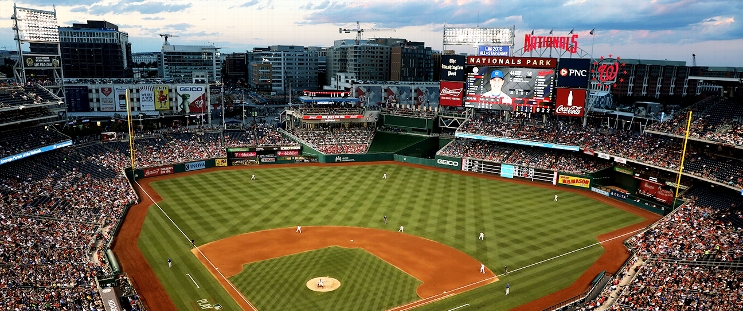
Detroit Tigers at Washington Nationals
· Major League Baseball
7 - 11

Wood has career-high five hits including 23rd HR, Nationals beat Tigers 11-7

Wood also had four singles, two RBI and scored three runs.
Alex Call had three hits for Washington, which has won three of four. Paul DeJong, in his third game back from the injured list, added a three-run homer.
After allowing three runs and three hits in the first, Irvin (7-3) tossed five scoreless innings and did not allow another hit.
It was career win No. 500 for Nationals manager Dave Martinez.
Detroit rallied late as Gleyber Torres and Wenceel Perez had RBI singles in the seventh. Parker Meadows singled home a run in the eighth and another scored on Javier Baez's ground out to make it 9-7. However, Luis Garcia Jr. and Call had RBI singles in the bottom half.
Spencer Torkelson hit a three-run homer for the AL-leading Tigers, who are 8-8 over their past 16 games.
Dietrich Enns (1-1) allowed eight runs and eight hits in four-plus innings for Detroit.
With two on and two out in the first, Torkelson ended a 10-pitch at-bat with his 19th home run.
Washington rallied in the first as Call's bases-loaded singled brought home two runs and DeJong followed with a three-run homer.
Wood made it 6-3 with a solo shot in the second and added an RBI single in the fourth.
How can I watch Detroit Tigers vs. Washington Nationals?
- TV Channel: Tigers at Nationals 2022 MLB Baseball, is broadcasted on MLB.TV.
- Online streaming: Sign up for Fubo.
Scoring Summary
 |
9th Inning | Greene struck out swinging. |
 |
9th Inning | Pérez popped out to shortstop. |
 |
9th Inning | Torres lined out to center. |
 |
9th Inning | Finnegan relieved Lord |
 |
9th Inning | Bell as designated hitter. |
 |
9th Inning | García Jr. at second base. |
Statistics
 DET DET |
 WSH WSH |
|
|---|---|---|
| 1 | Games Played | 1 |
| 1 | Team Games Played | 1 |
| 1 | Hit By Pitch | 0 |
| 11 | Ground Balls | 14 |
| 7 | Strikeouts | 6 |
| 7 | Runs Batted In | 11 |
| 0 | Sacrifice Hit | 0 |
| 8 | Hits | 15 |
| 0 | Stolen Bases | 2 |
| 4 | Walks | 3 |
| 0 | Catcher Interference | 0 |
| 7 | Runs | 11 |
| 0 | Ground Into Double Play | 1 |
| 0 | Sacrifice Flies | 0 |
| 35 | At Bats | 40 |
| 1 | Home Runs | 2 |
| 0 | Grand Slam Home Runs | 0 |
| 15 | Runners Left On Base | 22 |
| 0 | Triples | 0 |
| 0 | Game Winning RBIs | 1 |
| 0 | Intentional Walks | 0 |
| 0 | Doubles | 1 |
| 17 | Fly Balls | 20 |
| 0 | Caught Stealing | 0 |
| 161 | Pitches | 181 |
| 0 | Games Started | 0 |
| 0 | Pinch At Bats | 2 |
| 0 | Pinch Hits | 1 |
| 0.0 | Player Rating | 0.0 |
| 1 | Is Qualified | 1 |
| 0 | Is Qualified In Steals | 1 |
| 11 | Total Bases | 22 |
| 40 | Plate Appearances | 43 |
| 162.0 | Projected Home Runs | 324.0 |
| 1 | Extra Base Hits | 3 |
| 4.0 | Runs Created | 8.8 |
| .229 | Batting Average | .375 |
| .000 | Pinch Hit Average | .500 |
| .314 | Slugging Percentage | .550 |
| .200 | Secondary Average | .300 |
| .325 | On Base Percentage | .419 |
| .639 | OBP Pct + SLG Pct | .969 |
| 0.6 | Ground To Fly Ball Ratio | 0.7 |
| 4.0 | Runs Created Per 27 Outs | 9.1 |
| 39.0 | Batter Rating | 69.0 |
| 35.0 | At Bats Per Home Run | 20.0 |
| 0.00 | Stolen Base Percentage | 1.00 |
| 4.03 | Pitches Per Plate Appearance | 4.21 |
| .086 | Isolated Power | .175 |
| 0.57 | Walk To Strikeout Ratio | 0.50 |
| .100 | Walks Per Plate Appearance | .070 |
| -.029 | Secondary Average Minus Batting Average | -.075 |
| 14.0 | Runs Produced | 22.0 |
| 1.0 | Runs Ratio | 1.0 |
| 0.4 | Patience Ratio | 0.6 |
| 0.3 | Balls In Play Average | 0.4 |
| 84.8 | MLB Rating | 111.5 |
| 0.0 | Offensive Wins Above Replacement | 0.0 |
| 0.0 | Wins Above Replacement | 0.0 |
Game Information

Location: Washington, District of Columbia
Attendance: 31,599 | Capacity:
2025 American League Central Standings
| TEAM | W | L | PCT | GB | STRK |
|---|---|---|---|---|---|
 Detroit Detroit |
54 | 34 | .614 | - | L2 |
 Minnesota Minnesota |
41 | 46 | .471 | 12.5 | L1 |
 Cleveland Cleveland |
40 | 45 | .471 | 12.5 | L7 |
 Kansas City Kansas City |
41 | 47 | .466 | 13 | W1 |
 Chicago Chicago |
28 | 59 | .322 | 25.5 | L3 |
2025 National League East Standings
| TEAM | W | L | PCT | GB | STRK |
|---|---|---|---|---|---|
 Philadelphia Philadelphia |
51 | 36 | .586 | - | W1 |
 New York New York |
50 | 38 | .568 | 1.5 | W2 |
 Miami Miami |
39 | 46 | .459 | 11 | W1 |
 Atlanta Atlanta |
39 | 47 | .453 | 11.5 | L1 |
 Washington Washington |
37 | 50 | .425 | 14 | W2 |