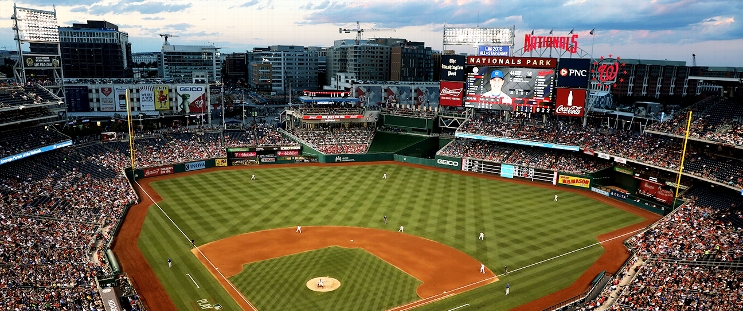
Boston Red Sox at Washington Nationals
· Major League Baseball
11 - 2

Trevor Story homers as part of 4-hit day to help Red Sox beat Nationals 11-2

Jarren Duran had three RBI for Boston, which collected 16 hits and has won four of six since enduring a season-worst six-game skid.
Washington was denied its first three-game winning streak since taking four in a row on May 28-31.
Giolito (5-1) allowed four hits and three walks while striking out seven, surrendering Luis García Jr.’s sacrifice fly in the sixth. He is 2-0 with an 0.61 ERA in his last two starts.
The right-hander was the Nationals’ first-round pick in 2012 and debuted with the team four years later. Washington traded him to the Chicago White Sox in December 2016.
The Red Sox broke the game open with a seven-run fifth inning. After Boston loaded the bases, Wilyer Abreu walked in a run to make it 3-0 and Story ripped a two-run single to center to chase Washington starter Michael Soroka (3-6).
Marcelo Mayer hit reliever Zach Brzykcy’s first pitch to left to score Abreu. Three batters later, Duran hit a two-run double. He later scored on Abraham Toro’s single.
Story hit his 13th home run of the season in the eighth, a two-run blast to left off Ryan Loutos.
Soroka allowed seven runs and struck out six in four innings, matching his shortest outing of the season.
How can I watch Boston Red Sox vs. Washington Nationals?
- TV Channel: Red Sox at Nationals 2022 MLB Baseball, is broadcasted on MLBN.
- Online streaming: Sign up for Fubo.
Scoring Summary
 |
9th Inning | Ruiz grounded out to second. |
 |
9th Inning | Lile doubled to center, House scored. |
 |
9th Inning | House grounded into fielder's choice to second, Lowe out at second. |
 |
9th Inning | Bell struck out swinging. |
 |
9th Inning | Lowe singled to right. |
 |
9th Inning | Whitlock relieved Wilson |
Statistics
 BOS BOS |
 WSH WSH |
|
|---|---|---|
| 1 | Games Played | 1 |
| 1 | Team Games Played | 1 |
| 1 | Hit By Pitch | 0 |
| 14 | Ground Balls | 8 |
| 9 | Strikeouts | 8 |
| 11 | Runs Batted In | 2 |
| 0 | Sacrifice Hit | 0 |
| 16 | Hits | 6 |
| 3 | Stolen Bases | 1 |
| 5 | Walks | 3 |
| 0 | Catcher Interference | 0 |
| 11 | Runs | 2 |
| 0 | Ground Into Double Play | 1 |
| 0 | Sacrifice Flies | 1 |
| 43 | At Bats | 31 |
| 1 | Home Runs | 0 |
| 0 | Grand Slam Home Runs | 0 |
| 25 | Runners Left On Base | 13 |
| 0 | Triples | 0 |
| 1 | Game Winning RBIs | 0 |
| 0 | Intentional Walks | 0 |
| 3 | Doubles | 1 |
| 20 | Fly Balls | 16 |
| 0 | Caught Stealing | 0 |
| 180 | Pitches | 129 |
| 0 | Games Started | 0 |
| 0 | Pinch At Bats | 0 |
| 0 | Pinch Hits | 0 |
| 0.0 | Player Rating | 0.0 |
| 1 | Is Qualified | 1 |
| 1 | Is Qualified In Steals | 1 |
| 22 | Total Bases | 7 |
| 49 | Plate Appearances | 35 |
| 162.0 | Projected Home Runs | 0.0 |
| 4 | Extra Base Hits | 1 |
| 10.4 | Runs Created | 1.7 |
| .372 | Batting Average | .194 |
| .000 | Pinch Hit Average | .000 |
| .512 | Slugging Percentage | .226 |
| .326 | Secondary Average | .161 |
| .449 | On Base Percentage | .257 |
| .961 | OBP Pct + SLG Pct | .483 |
| 0.7 | Ground To Fly Ball Ratio | 0.5 |
| 10.4 | Runs Created Per 27 Outs | 1.7 |
| 72.0 | Batter Rating | 17.0 |
| 43.0 | At Bats Per Home Run | 0.0 |
| 1.00 | Stolen Base Percentage | 1.00 |
| 3.67 | Pitches Per Plate Appearance | 3.69 |
| .140 | Isolated Power | .032 |
| 0.56 | Walk To Strikeout Ratio | 0.38 |
| .102 | Walks Per Plate Appearance | .086 |
| -.047 | Secondary Average Minus Batting Average | -.032 |
| 22.0 | Runs Produced | 4.0 |
| 1.0 | Runs Ratio | 1.0 |
| 0.6 | Patience Ratio | 0.3 |
| 0.5 | Balls In Play Average | 0.3 |
| 112.3 | MLB Rating | 69.0 |
| 0.0 | Offensive Wins Above Replacement | 0.0 |
| 0.0 | Wins Above Replacement | 0.0 |
Game Information

Location: Washington, District of Columbia
Attendance: 37,355 | Capacity:
2025 American League East Standings
| TEAM | W | L | PCT | GB | STRK |
|---|---|---|---|---|---|
 Toronto Toronto |
50 | 38 | .568 | - | W6 |
 New York New York |
48 | 40 | .545 | 2 | L5 |
 Tampa Bay Tampa Bay |
48 | 40 | .545 | 2 | L1 |
 Boston Boston |
44 | 45 | .494 | 6.5 | W1 |
 Baltimore Baltimore |
38 | 49 | .437 | 11.5 | W1 |
2025 National League East Standings
| TEAM | W | L | PCT | GB | STRK |
|---|---|---|---|---|---|
 Philadelphia Philadelphia |
51 | 37 | .580 | - | L1 |
 New York New York |
51 | 38 | .573 | 0.5 | W3 |
 Miami Miami |
39 | 47 | .453 | 11 | L1 |
 Atlanta Atlanta |
39 | 48 | .448 | 11.5 | L2 |
 Washington Washington |
37 | 51 | .420 | 14 | L1 |