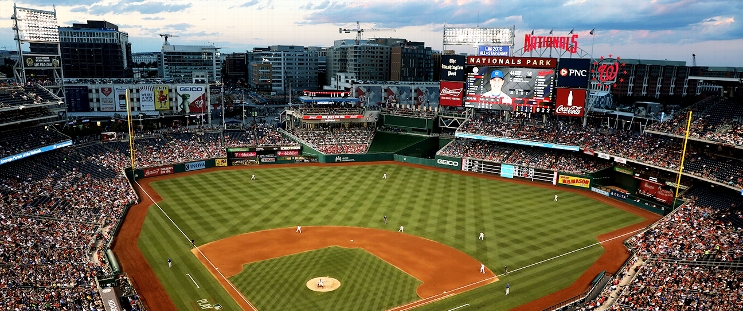
Boston Red Sox at Washington Nationals
· Major League Baseball
10 - 3

Rafaela homers as Red Sox rout Nationals 10-3 for 10,000th win in franchise history

Romy Gonzalez had three hits for Boston (45-45), which has won five of seven. The Red Sox are the second American League franchise to reach 10,000 victories, joining the New York Yankees.
Daylen Lile extended his hitting streak to 12 games for Washington (37-52), which is tied for a season-high 15 games under .500. The Nationals fell to 18-27 at home, the third-worst record in the majors behind Colorado and the Athletics.
Just as they did in Friday’s 11-2 victory over Washington, the Red Sox broke it open with a seven-run inning. Roman Anthony made it 3-0 in the third with an RBI single, and four batters later Jarren Duran hit a two-run triple.
Nationals starter Mitchell Parker (5-9) misplayed Abraham Toro’s grounder to allow Duran to score, and Rafaela hit the next pitch into the seats in left field to make it 8-0. Gonzalez tacked on a two-out RBI single to finish the outburst.
Gonzalez and Rob Refsnyder had RBI doubles in the first to open the scoring.
Buehler (6-6) allowed three runs — two earned — in five-plus innings. He improved to 3-1 with a 2.67 ERA in six lifetime appearances against Washington.
Parker tied a career high with nine runs allowed, though only four were earned. He gave up 10 hits and struck out four in six innings.
How can I watch Boston Red Sox vs. Washington Nationals?
- TV Channel: Red Sox at Nationals 2022 MLB Baseball, is broadcasted on MLB.TV.
- Online streaming: Sign up for Fubo.
Scoring Summary
 |
9th Inning | Young struck out looking. |
 |
9th Inning | Ruiz flied out to right. |
 |
9th Inning | Lile grounded out to shortstop. |
 |
9th Inning | Alcala relieved Bernardino |
 |
9th Inning | Narváez grounded out to third. |
 |
9th Inning | Refsnyder flied out to right. |
Statistics
 BOS BOS |
 WSH WSH |
|
|---|---|---|
| 1 | Games Played | 1 |
| 1 | Team Games Played | 1 |
| 0 | Hit By Pitch | 0 |
| 15 | Ground Balls | 17 |
| 6 | Strikeouts | 4 |
| 9 | Runs Batted In | 2 |
| 0 | Sacrifice Hit | 0 |
| 11 | Hits | 9 |
| 0 | Stolen Bases | 0 |
| 1 | Walks | 0 |
| 0 | Catcher Interference | 0 |
| 10 | Runs | 3 |
| 0 | Ground Into Double Play | 1 |
| 0 | Sacrifice Flies | 0 |
| 40 | At Bats | 36 |
| 1 | Home Runs | 0 |
| 0 | Grand Slam Home Runs | 0 |
| 9 | Runners Left On Base | 16 |
| 1 | Triples | 1 |
| 1 | Game Winning RBIs | 0 |
| 0 | Intentional Walks | 0 |
| 5 | Doubles | 0 |
| 19 | Fly Balls | 15 |
| 0 | Caught Stealing | 0 |
| 125 | Pitches | 138 |
| 0 | Games Started | 0 |
| 0 | Pinch At Bats | 0 |
| 0 | Pinch Hits | 0 |
| 0.0 | Player Rating | 0.0 |
| 1 | Is Qualified | 1 |
| 0 | Is Qualified In Steals | 0 |
| 21 | Total Bases | 11 |
| 41 | Plate Appearances | 36 |
| 162.0 | Projected Home Runs | 0.0 |
| 7 | Extra Base Hits | 1 |
| 6.2 | Runs Created | 2.2 |
| .275 | Batting Average | .250 |
| .000 | Pinch Hit Average | .000 |
| .525 | Slugging Percentage | .306 |
| .275 | Secondary Average | .056 |
| .293 | On Base Percentage | .250 |
| .818 | OBP Pct + SLG Pct | .556 |
| 0.8 | Ground To Fly Ball Ratio | 1.1 |
| 5.8 | Runs Created Per 27 Outs | 2.2 |
| 64.5 | Batter Rating | 21.5 |
| 40.0 | At Bats Per Home Run | 0.0 |
| 0.00 | Stolen Base Percentage | 0.00 |
| 3.05 | Pitches Per Plate Appearance | 3.83 |
| .250 | Isolated Power | .056 |
| 0.17 | Walk To Strikeout Ratio | 0.00 |
| .024 | Walks Per Plate Appearance | .000 |
| .000 | Secondary Average Minus Batting Average | -.194 |
| 19.0 | Runs Produced | 5.0 |
| 0.9 | Runs Ratio | 0.7 |
| 0.5 | Patience Ratio | 0.3 |
| 0.3 | Balls In Play Average | 0.3 |
| 101.5 | MLB Rating | 76.3 |
| 0.0 | Offensive Wins Above Replacement | 0.0 |
| 0.0 | Wins Above Replacement | 0.0 |
Game Information

Location: Washington, District of Columbia
Attendance: 34,319 | Capacity:
2025 American League East Standings
| TEAM | W | L | PCT | GB | STRK |
|---|---|---|---|---|---|
 Toronto Toronto |
53 | 38 | .582 | - | W9 |
 New York New York |
49 | 41 | .544 | 3.5 | W1 |
 Tampa Bay Tampa Bay |
49 | 42 | .538 | 4 | L1 |
 Boston Boston |
47 | 45 | .511 | 6.5 | W4 |
 Baltimore Baltimore |
40 | 49 | .449 | 12 | W3 |
2025 National League East Standings
| TEAM | W | L | PCT | GB | STRK |
|---|---|---|---|---|---|
 Philadelphia Philadelphia |
53 | 38 | .582 | - | L1 |
 New York New York |
52 | 39 | .571 | 1 | L1 |
 Miami Miami |
41 | 48 | .461 | 11 | W1 |
 Atlanta Atlanta |
39 | 50 | .438 | 13 | L4 |
 Washington Washington |
37 | 53 | .411 | 15.5 | L3 |