Pittsburgh Pirates at Seattle Mariners
· Major League Baseball
Pittsburgh Pirates
38-51, 12-30 Awayvs

Seattle Mariners
46-42, 23-21 HomePirates bring road slide into matchup with the Mariners
How can I watch Pittsburgh Pirates vs. Seattle Mariners?
- TV Channel: Pirates at Mariners 2022 MLB Baseball, is broadcasted on FS1.
- Online streaming: Sign up for Fubo.
Matchup Prediction
Mariners: 70.8%
Pirates: 29.2%
*According to ESPN's Basketball Power Index
Statistics
 PIT PIT |
 SEA SEA |
|
|---|---|---|
| 89 | Games Played | 88 |
| 89 | Team Games Played | 88 |
| 30 | Hit By Pitch | 47 |
| 1002 | Ground Balls | 984 |
| 773 | Strikeouts | 770 |
| 300 | Runs Batted In | 387 |
| 8 | Sacrifice Hit | 15 |
| 687 | Hits | 752 |
| 77 | Stolen Bases | 80 |
| 287 | Walks | 299 |
| 4 | Catcher Interference | 0 |
| 310 | Runs | 400 |
| 76 | Ground Into Double Play | 57 |
| 21 | Sacrifice Flies | 22 |
| 2942 | At Bats | 3030 |
| 61 | Home Runs | 118 |
| 1 | Grand Slam Home Runs | 6 |
| 0 | Runners Left On Base | 0 |
| 14 | Triples | 4 |
| 36 | Game Winning RBIs | 46 |
| 12 | Intentional Walks | 14 |
| 118 | Doubles | 121 |
| 1196 | Fly Balls | 1313 |
| 22 | Caught Stealing | 23 |
| 12874 | Pitches | 13372 |
| 89 | Games Started | 88 |
| 47 | Pinch At Bats | 99 |
| 12 | Pinch Hits | 18 |
| 0.0 | Player Rating | 0.0 |
| 1 | Is Qualified | 1 |
| 1 | Is Qualified In Steals | 1 |
| 1016 | Total Bases | 1235 |
| 3292 | Plate Appearances | 3413 |
| 111.0 | Projected Home Runs | 217.0 |
| 193 | Extra Base Hits | 243 |
| 312.1 | Runs Created | 409.6 |
| .234 | Batting Average | .248 |
| .255 | Pinch Hit Average | .182 |
| .345 | Slugging Percentage | .408 |
| .228 | Secondary Average | .277 |
| .306 | On Base Percentage | .323 |
| .651 | OBP Pct + SLG Pct | .731 |
| 0.8 | Ground To Fly Ball Ratio | 0.7 |
| 3.5 | Runs Created Per 27 Outs | 4.6 |
| 2438.0 | Batter Rating | 3012.0 |
| 48.2 | At Bats Per Home Run | 25.7 |
| 0.78 | Stolen Base Percentage | 0.78 |
| 3.91 | Pitches Per Plate Appearance | 3.92 |
| .112 | Isolated Power | .159 |
| 0.37 | Walk To Strikeout Ratio | 0.39 |
| .087 | Walks Per Plate Appearance | .088 |
| -.005 | Secondary Average Minus Batting Average | .029 |
| 610.0 | Runs Produced | 787.0 |
| 1.0 | Runs Ratio | 1.0 |
| 0.4 | Patience Ratio | 0.5 |
| 0.3 | Balls In Play Average | 0.3 |
| 1715.3 | MLB Rating | 2181.0 |
| 0.0 | Offensive Wins Above Replacement | 0.0 |
| 0.0 | Wins Above Replacement | 0.0 |
Game Information

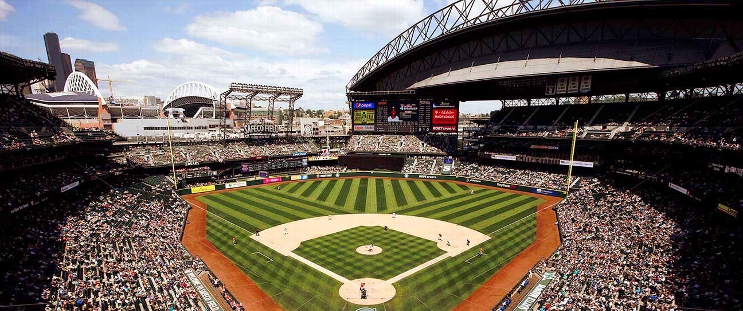
T-Mobile Park
Location: Seattle, Washington -
69°
Capacity:
2025 National League Central Standings
| TEAM | W | L | PCT | GB | STRK |
|---|---|---|---|---|---|
 Chicago Chicago |
53 | 36 | .596 | - | L1 |
 Milwaukee Milwaukee |
49 | 39 | .557 | 3.5 | W1 |
 St. Louis St. Louis |
48 | 42 | .533 | 5.5 | W1 |
 Cincinnati Cincinnati |
46 | 42 | .523 | 6.5 | W2 |
 Pittsburgh Pittsburgh |
38 | 51 | .427 | 15 | L1 |
2025 American League West Standings
| TEAM | W | L | PCT | GB | STRK |
|---|---|---|---|---|---|
 Houston Houston |
53 | 35 | .602 | - | W1 |
 Seattle Seattle |
46 | 42 | .523 | 7 | W1 |
 Los Angeles Los Angeles |
43 | 44 | .494 | 9.5 | L1 |
 Texas Texas |
43 | 45 | .489 | 10 | L1 |
 Athletics Athletics |
37 | 53 | .411 | 17 | W1 |
 NYM
NYM KC
KC