Pittsburgh Pirates at Kansas City Royals
· Major League Baseball
Pittsburgh Pirates
38-50, 12-29 Awayvs

Kansas City Royals
40-47, 20-24 HomeHow To Watch
How can I watch Pittsburgh Pirates vs. Kansas City Royals?
- TV Channel: Pirates at Royals 2022 MLB Baseball, is broadcasted on MLB.TV.
- Online streaming: Sign up for Fubo.
Matchup Prediction
Royals: 40.5%
Pirates: 59.5%
*According to ESPN's Basketball Power Index
Statistics
 PIT PIT |
 KC KC |
|
|---|---|---|
| 88 | Games Played | 87 |
| 88 | Team Games Played | 87 |
| 30 | Hit By Pitch | 29 |
| 994 | Ground Balls | 950 |
| 761 | Strikeouts | 601 |
| 300 | Runs Batted In | 283 |
| 8 | Sacrifice Hit | 19 |
| 682 | Hits | 708 |
| 75 | Stolen Bases | 66 |
| 284 | Walks | 210 |
| 4 | Catcher Interference | 1 |
| 310 | Runs | 287 |
| 76 | Ground Into Double Play | 44 |
| 21 | Sacrifice Flies | 23 |
| 2910 | At Bats | 2912 |
| 61 | Home Runs | 58 |
| 1 | Grand Slam Home Runs | 0 |
| 0 | Runners Left On Base | 0 |
| 14 | Triples | 15 |
| 36 | Game Winning RBIs | 40 |
| 12 | Intentional Walks | 13 |
| 117 | Doubles | 147 |
| 1184 | Fly Balls | 1403 |
| 22 | Caught Stealing | 29 |
| 12737 | Pitches | 12037 |
| 88 | Games Started | 87 |
| 47 | Pinch At Bats | 49 |
| 12 | Pinch Hits | 6 |
| 0.0 | Player Rating | 0.0 |
| 1 | Is Qualified | 1 |
| 1 | Is Qualified In Steals | 1 |
| 1010 | Total Bases | 1059 |
| 3257 | Plate Appearances | 3194 |
| 112.0 | Projected Home Runs | 108.0 |
| 192 | Extra Base Hits | 220 |
| 310.7 | Runs Created | 318.9 |
| .234 | Batting Average | .243 |
| .255 | Pinch Hit Average | .122 |
| .347 | Slugging Percentage | .364 |
| .229 | Secondary Average | .205 |
| .307 | On Base Percentage | .298 |
| .654 | OBP Pct + SLG Pct | .662 |
| 0.8 | Ground To Fly Ball Ratio | 0.7 |
| 3.6 | Runs Created Per 27 Outs | 3.7 |
| 2429.0 | Batter Rating | 2419.5 |
| 47.7 | At Bats Per Home Run | 50.2 |
| 0.77 | Stolen Base Percentage | 0.69 |
| 3.91 | Pitches Per Plate Appearance | 3.77 |
| .113 | Isolated Power | .121 |
| 0.37 | Walk To Strikeout Ratio | 0.35 |
| .087 | Walks Per Plate Appearance | .066 |
| -.006 | Secondary Average Minus Batting Average | -.038 |
| 610.0 | Runs Produced | 570.0 |
| 1.0 | Runs Ratio | 1.0 |
| 0.4 | Patience Ratio | 0.4 |
| 0.3 | Balls In Play Average | 0.3 |
| 1712.8 | MLB Rating | 1774.3 |
| 0.0 | Offensive Wins Above Replacement | 0.0 |
| 0.0 | Wins Above Replacement | 0.0 |
Game Information

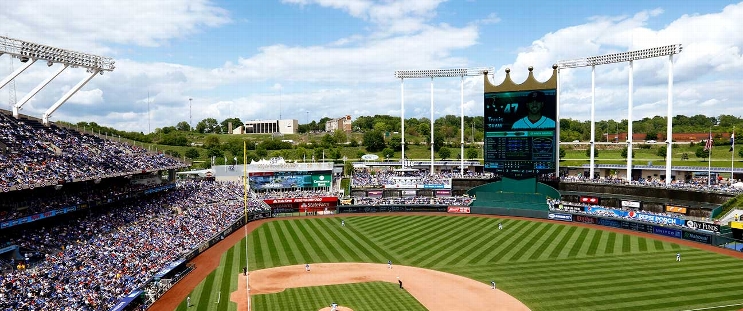
Kauffman Stadium
Location: Kansas City, Missouri -
86°
Capacity:
2025 National League Central Standings
| TEAM | W | L | PCT | GB | STRK |
|---|---|---|---|---|---|
 Chicago Chicago |
51 | 35 | .593 | - | W2 |
 Milwaukee Milwaukee |
48 | 38 | .558 | 3 | L1 |
 St. Louis St. Louis |
47 | 41 | .534 | 5 | L3 |
 Cincinnati Cincinnati |
45 | 42 | .517 | 6.5 | W1 |
 Pittsburgh Pittsburgh |
38 | 50 | .432 | 14 | W6 |
2025 American League Central Standings
| TEAM | W | L | PCT | GB | STRK |
|---|---|---|---|---|---|
 Detroit Detroit |
54 | 34 | .614 | - | L2 |
 Cleveland Cleveland |
40 | 44 | .476 | 12 | L6 |
 Minnesota Minnesota |
41 | 46 | .471 | 12.5 | L1 |
 Kansas City Kansas City |
40 | 47 | .460 | 13.5 | L1 |
 Chicago Chicago |
28 | 58 | .326 | 25 | L2 |
 NYM
NYM LAD
LAD SEA
SEA