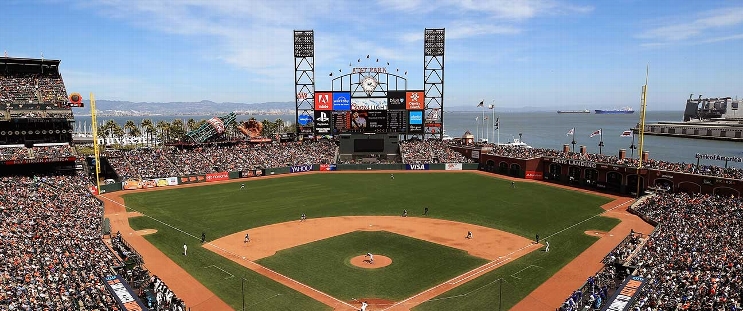
Philadelphia Phillies at San Francisco Giants
· Major League Baseball
1 - 3

Giants score 2 in 8th inning to beat Phillies 3-1

Orion Kerkering (5-4) hit Willy Adames with a pitch to start the Giants’ eighth before Chapman’s single advanced Adames to third. Wilmer Flores was also plunked to load the bases for Schmitt.
The Phillies tied the score at 1 in the fifth on a wild pitch by San Francisco starter Landen Roupp.
Schmitt returned for the Giants following a 10-game absence after being hit on the left hand by a pitch June 25.
Philadelphia’s offense went cold. The Phillies had won three of four and five of seven, scoring 29 runs.
Bryce Harper was then called out on strikes to end the threat.
---
How can I watch Philadelphia Phillies vs. San Francisco Giants?
- TV Channel: Phillies at Giants 2022 MLB Baseball, is broadcasted on MLBN.
- Online streaming: Sign up for Fubo.
Scoring Summary
 |
9th Inning | Stott grounded into double play, first to shortstop, Kepler out at second. |
 |
9th Inning | Realmuto lined out to second. |
 |
9th Inning | Kepler walked. |
 |
9th Inning | Doval relieved Rogers |
 |
9th Inning | Yastrzemski in right field. |
 |
8th Inning | Bailey struck out swinging. |
Statistics
 PHI PHI |
 SF SF |
|
|---|---|---|
| 1 | Games Played | 1 |
| 1 | Team Games Played | 1 |
| 0 | Hit By Pitch | 2 |
| 17 | Ground Balls | 19 |
| 5 | Strikeouts | 9 |
| 0 | Runs Batted In | 3 |
| 1 | Sacrifice Hit | 0 |
| 6 | Hits | 8 |
| 0 | Stolen Bases | 0 |
| 3 | Walks | 1 |
| 0 | Catcher Interference | 0 |
| 1 | Runs | 3 |
| 1 | Ground Into Double Play | 0 |
| 0 | Sacrifice Flies | 0 |
| 31 | At Bats | 33 |
| 0 | Home Runs | 0 |
| 0 | Grand Slam Home Runs | 0 |
| 17 | Runners Left On Base | 22 |
| 0 | Triples | 0 |
| 0 | Game Winning RBIs | 1 |
| 0 | Intentional Walks | 0 |
| 1 | Doubles | 2 |
| 10 | Fly Balls | 5 |
| 0 | Caught Stealing | 0 |
| 166 | Pitches | 136 |
| 0 | Games Started | 0 |
| 0 | Pinch At Bats | 1 |
| 0 | Pinch Hits | 0 |
| 0.0 | Player Rating | 0.0 |
| 1 | Is Qualified | 1 |
| 0 | Is Qualified In Steals | 0 |
| 7 | Total Bases | 10 |
| 35 | Plate Appearances | 36 |
| 0.0 | Projected Home Runs | 0.0 |
| 1 | Extra Base Hits | 2 |
| 1.5 | Runs Created | 3.2 |
| .194 | Batting Average | .242 |
| .000 | Pinch Hit Average | .000 |
| .226 | Slugging Percentage | .303 |
| .129 | Secondary Average | .091 |
| .265 | On Base Percentage | .306 |
| .491 | OBP Pct + SLG Pct | .609 |
| 1.7 | Ground To Fly Ball Ratio | 3.8 |
| 1.5 | Runs Created Per 27 Outs | 3.5 |
| 10.0 | Batter Rating | 24.0 |
| 0.0 | At Bats Per Home Run | 0.0 |
| 0.00 | Stolen Base Percentage | 0.00 |
| 4.74 | Pitches Per Plate Appearance | 3.78 |
| .032 | Isolated Power | .061 |
| 0.60 | Walk To Strikeout Ratio | 0.11 |
| .086 | Walks Per Plate Appearance | .028 |
| -.065 | Secondary Average Minus Batting Average | -.152 |
| 1.0 | Runs Produced | 6.0 |
| 0.0 | Runs Ratio | 1.0 |
| 0.3 | Patience Ratio | 0.4 |
| 0.2 | Balls In Play Average | 0.3 |
| 66.5 | MLB Rating | 75.3 |
| 0.0 | Offensive Wins Above Replacement | 0.0 |
| 0.0 | Wins Above Replacement | 0.0 |
Game Information

Location: San Francisco, California
Attendance: 40,043 | Capacity:
2025 National League East Standings
| TEAM | W | L | PCT | GB | STRK |
|---|---|---|---|---|---|
 New York New York |
53 | 39 | .576 | - | W1 |
 Philadelphia Philadelphia |
53 | 39 | .576 | - | L2 |
 Miami Miami |
42 | 48 | .467 | 10 | W2 |
 Atlanta Atlanta |
39 | 51 | .433 | 13 | L5 |
 Washington Washington |
37 | 54 | .407 | 15.5 | L4 |
2025 National League West Standings
| TEAM | W | L | PCT | GB | STRK |
|---|---|---|---|---|---|
 Los Angeles Los Angeles |
56 | 37 | .602 | - | L5 |
 San Francisco San Francisco |
51 | 42 | .548 | 5 | W4 |
 San Diego San Diego |
49 | 42 | .538 | 6 | W1 |
 Arizona Arizona |
45 | 47 | .489 | 10.5 | L1 |
 Colorado Colorado |
21 | 71 | .228 | 34.5 | L2 |