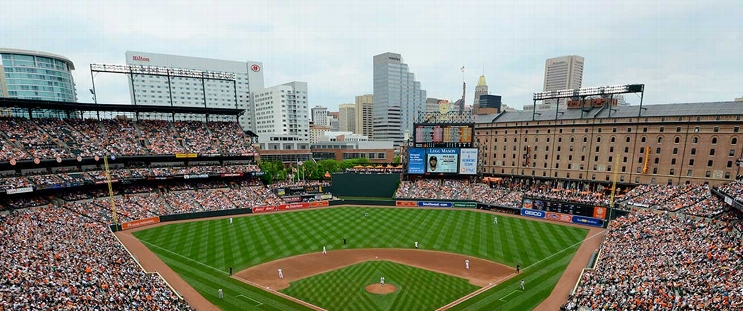
New York Mets at Baltimore Orioles
· Major League Baseball
7 - 6

Juan Soto drives in go-ahead run in 10th to help Mets rally past Orioles 7-6

New York trailed 6-2 before rallying past the Orioles to improve to 5-34 when trailing after seven innings.
Ronny Mauricio, Francisco Lindor and Pete Alonso homered for the Mets, who are in hot pursuit of first-place Philadelphia in the NL East.
Soto hit the first pitch from Yennier Cano (1-5) to score Lindor in the 10th, and Huascar Brazobán worked the bottom half for his second save.
Edwin Diaz (4-0) pitched the ninth inning for New York.
The Orioles got an immaculate inning — three strikeouts on nine pitches — from rookie starter Brandon Young, and Jackson Holliday homered for a 6-2 lead in the seventh.
Young's immaculate inning came in the fifth. After Jesse Winker and Jeff McNeil struck out swinging, Luis Torres looked at a third strike to end the first immaculate inning by an Oriole since Kevin Guzman against Cleveland on April 23, 2018.
Young returned in the sixth to lose a 1-0 lead and the bid for his first big league win. Mauricio opened the sixth with a shot over the right-field scoreboard, and successive doubles by Brett Baty and Brandon Nimmo put the Mets in front.
How can I watch New York Mets vs. Baltimore Orioles?
- TV Channel: Mets at Orioles 2022 MLB Baseball, is broadcasted on MLB.TV.
- Online streaming: Sign up for Fubo.
Scoring Summary
 |
10th Inning | O'Hearn grounded out to second. |
 |
10th Inning | Henderson fouled out to third. |
 |
10th Inning | Westburg struck out swinging. |
 |
10th Inning | Brazobán relieved Díaz |
 |
10th Inning | Jankowski as designated hitter. |
 |
10th Inning | Mauricio lined out to first. |
Statistics
 NYM NYM |
 BAL BAL |
|
|---|---|---|
| 1 | Games Played | 1 |
| 1 | Team Games Played | 1 |
| 0 | Hit By Pitch | 2 |
| 11 | Ground Balls | 17 |
| 13 | Strikeouts | 8 |
| 7 | Runs Batted In | 6 |
| 1 | Sacrifice Hit | 0 |
| 11 | Hits | 9 |
| 1 | Stolen Bases | 1 |
| 4 | Walks | 2 |
| 0 | Catcher Interference | 0 |
| 7 | Runs | 6 |
| 1 | Ground Into Double Play | 1 |
| 0 | Sacrifice Flies | 0 |
| 39 | At Bats | 36 |
| 3 | Home Runs | 1 |
| 0 | Grand Slam Home Runs | 0 |
| 16 | Runners Left On Base | 15 |
| 0 | Triples | 0 |
| 1 | Game Winning RBIs | 0 |
| 2 | Intentional Walks | 0 |
| 2 | Doubles | 1 |
| 16 | Fly Balls | 11 |
| 0 | Caught Stealing | 1 |
| 153 | Pitches | 154 |
| 0 | Games Started | 0 |
| 1 | Pinch At Bats | 1 |
| 0 | Pinch Hits | 0 |
| 0.0 | Player Rating | 0.0 |
| 1 | Is Qualified | 1 |
| 1 | Is Qualified In Steals | 1 |
| 22 | Total Bases | 13 |
| 44 | Plate Appearances | 40 |
| 486.0 | Projected Home Runs | 162.0 |
| 5 | Extra Base Hits | 2 |
| 7.5 | Runs Created | 4.0 |
| .282 | Batting Average | .250 |
| .000 | Pinch Hit Average | .000 |
| .564 | Slugging Percentage | .361 |
| .410 | Secondary Average | .167 |
| .349 | On Base Percentage | .325 |
| .913 | OBP Pct + SLG Pct | .686 |
| 0.7 | Ground To Fly Ball Ratio | 1.5 |
| 6.7 | Runs Created Per 27 Outs | 3.7 |
| 53.0 | Batter Rating | 39.0 |
| 13.0 | At Bats Per Home Run | 36.0 |
| 1.00 | Stolen Base Percentage | 0.50 |
| 3.48 | Pitches Per Plate Appearance | 3.85 |
| .282 | Isolated Power | .111 |
| 0.31 | Walk To Strikeout Ratio | 0.25 |
| .091 | Walks Per Plate Appearance | .050 |
| .128 | Secondary Average Minus Batting Average | -.083 |
| 14.0 | Runs Produced | 12.0 |
| 1.0 | Runs Ratio | 1.0 |
| 0.6 | Patience Ratio | 0.4 |
| 0.3 | Balls In Play Average | 0.3 |
| 97.3 | MLB Rating | 85.3 |
| 0.0 | Offensive Wins Above Replacement | 0.0 |
| 0.0 | Wins Above Replacement | 0.0 |
Game Information

Location: Baltimore, Maryland
Attendance: 35,200 | Capacity:
2025 National League East Standings
| TEAM | W | L | PCT | GB | STRK |
|---|---|---|---|---|---|
 New York New York |
53 | 39 | .576 | - | W1 |
 Philadelphia Philadelphia |
53 | 39 | .576 | - | L2 |
 Miami Miami |
42 | 48 | .467 | 10 | W2 |
 Atlanta Atlanta |
39 | 51 | .433 | 13 | L5 |
 Washington Washington |
37 | 54 | .407 | 15.5 | L4 |
2025 American League East Standings
| TEAM | W | L | PCT | GB | STRK |
|---|---|---|---|---|---|
 Toronto Toronto |
54 | 38 | .587 | - | W10 |
 New York New York |
50 | 41 | .549 | 3.5 | W2 |
 Tampa Bay Tampa Bay |
49 | 43 | .533 | 5 | L2 |
 Boston Boston |
48 | 45 | .516 | 6.5 | W5 |
 Baltimore Baltimore |
40 | 50 | .444 | 13 | L1 |