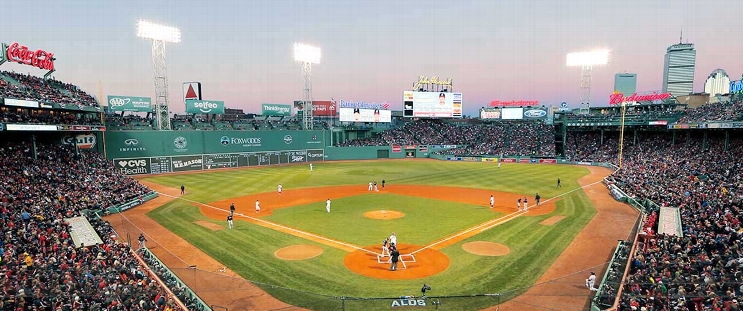
Colorado Rockies at Boston Red Sox
· Major League Baseball
2 - 10

Yoshida leads Red Sox to sweep of Rockies with 10-2 win

Carlos Narváez, Wilyer Abreu, Romy Gonzalez and Jarren Duran homered for the Red Sox, who matched a season best with their sixth straight win.
Lucas Giolito (6-1) went six scoreless innings, giving up four hits and no walks with six strikeouts.
Narváez led off the second inning with his eighth home run of the season. Abreu added a two-out, two-run homer in the fifth.
Gonzalez hit a two-run homer in the eighth, scoring Yoshida after his ground-rule double, and Jarren Duran added a three-run shot in the inning.
Yoshida, the designated hitter, also singled in the second and fourth innings.
Colorado's Kyle Farmer hit two-run homer in the eighth inning off right-handed reliever Isaiah Campbell.
Tyler Freeman’s single leading off the fourth inning for the Rockies extended his career-best on-base streak to 23 games, the longest active streak in the majors.
How can I watch Colorado Rockies vs. Boston Red Sox?
- TV Channel: Rockies at Red Sox 2022 MLB Baseball, is broadcasted on MLB.TV.
- Online streaming: Sign up for Fubo.
Scoring Summary
 |
9th Inning | Doyle lined out to right. |
 |
9th Inning | Toglia singled to left. |
 |
9th Inning | McMahon grounded into double play, first to shortstop to pitcher, Beck out at second. |
 |
9th Inning | Beck singled to left. |
 |
8th Inning | Abreu grounded into double play, second to shortstop to first, Anthony out at second. |
 |
8th Inning | Story struck out swinging. |
Statistics
 COL COL |
 BOS BOS |
|
|---|---|---|
| 1 | Games Played | 1 |
| 1 | Team Games Played | 1 |
| 0 | Hit By Pitch | 1 |
| 12 | Ground Balls | 11 |
| 7 | Strikeouts | 5 |
| 2 | Runs Batted In | 10 |
| 0 | Sacrifice Hit | 0 |
| 8 | Hits | 15 |
| 0 | Stolen Bases | 0 |
| 0 | Walks | 3 |
| 0 | Catcher Interference | 0 |
| 2 | Runs | 10 |
| 1 | Ground Into Double Play | 3 |
| 0 | Sacrifice Flies | 0 |
| 32 | At Bats | 36 |
| 1 | Home Runs | 4 |
| 0 | Grand Slam Home Runs | 0 |
| 6 | Runners Left On Base | 19 |
| 0 | Triples | 0 |
| 0 | Game Winning RBIs | 1 |
| 0 | Intentional Walks | 0 |
| 1 | Doubles | 4 |
| 13 | Fly Balls | 20 |
| 1 | Caught Stealing | 0 |
| 123 | Pitches | 143 |
| 0 | Games Started | 0 |
| 0 | Pinch At Bats | 0 |
| 0 | Pinch Hits | 0 |
| 0.0 | Player Rating | 0.0 |
| 1 | Is Qualified | 1 |
| 1 | Is Qualified In Steals | 0 |
| 12 | Total Bases | 31 |
| 32 | Plate Appearances | 40 |
| 162.0 | Projected Home Runs | 648.0 |
| 2 | Extra Base Hits | 8 |
| 2.2 | Runs Created | 11.3 |
| .250 | Batting Average | .417 |
| .000 | Pinch Hit Average | .000 |
| .375 | Slugging Percentage | .861 |
| .094 | Secondary Average | .528 |
| .250 | On Base Percentage | .475 |
| .625 | OBP Pct + SLG Pct | 1.336 |
| 0.9 | Ground To Fly Ball Ratio | 0.6 |
| 2.3 | Runs Created Per 27 Outs | 12.7 |
| 21.0 | Batter Rating | 75.0 |
| 32.0 | At Bats Per Home Run | 9.0 |
| 0.00 | Stolen Base Percentage | 0.00 |
| 3.84 | Pitches Per Plate Appearance | 3.58 |
| .125 | Isolated Power | .444 |
| 0.00 | Walk To Strikeout Ratio | 0.60 |
| .000 | Walks Per Plate Appearance | .075 |
| -.156 | Secondary Average Minus Batting Average | .111 |
| 4.0 | Runs Produced | 20.0 |
| 1.0 | Runs Ratio | 1.0 |
| 0.4 | Patience Ratio | 0.9 |
| 0.3 | Balls In Play Average | 0.4 |
| 75.0 | MLB Rating | 119.5 |
| 0.0 | Offensive Wins Above Replacement | 0.0 |
| 0.0 | Wins Above Replacement | 0.0 |
Game Information

Location: Boston, Massachusetts
Attendance: 31,691 | Capacity:
2025 National League West Standings
| TEAM | W | L | PCT | GB | STRK |
|---|---|---|---|---|---|
 Los Angeles Los Angeles |
58 | 39 | .598 | - | W2 |
 San Diego San Diego |
52 | 44 | .542 | 5.5 | L1 |
 San Francisco San Francisco |
52 | 45 | .536 | 6 | L2 |
 Arizona Arizona |
47 | 50 | .485 | 11 | W1 |
 Colorado Colorado |
22 | 74 | .229 | 35.5 | L2 |
2025 American League East Standings
| TEAM | W | L | PCT | GB | STRK |
|---|---|---|---|---|---|
 Toronto Toronto |
55 | 41 | .573 | - | L2 |
 New York New York |
53 | 43 | .552 | 2 | L2 |
 Boston Boston |
53 | 45 | .541 | 3 | W10 |
 Tampa Bay Tampa Bay |
50 | 47 | .515 | 5.5 | L4 |
 Baltimore Baltimore |
43 | 52 | .453 | 11.5 | L2 |