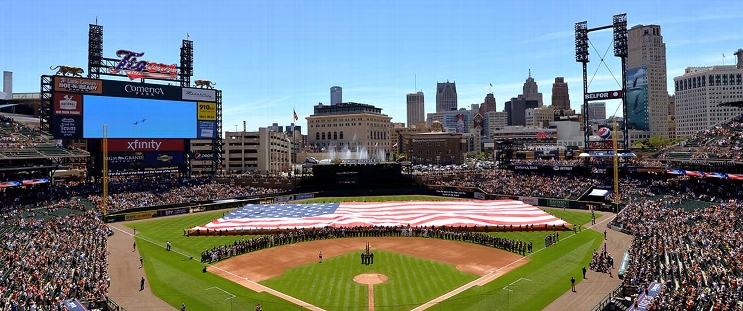
Tampa Bay Rays at Detroit Tigers
· Major League Baseball
7 - 3

Junior Caminero homers, scores twice to help the Rays end the Tigers' winning streak

Down 3-2 after five innings, the Rays scored four times in the sixth and Caminero led off the seventh with his 22nd homer — a blast over the Detroit bullpen in left.
The Rays broke it open against reliever Chase Lee in the sixth. With two out and a runner on second, Lee replaced Brant Hurter (4-1) and allowed four straight run-scoring hits, including doubles by Ha-Seong Kim and Danny Jansen.
The Tigers loaded the bases in the seventh, but Garrett Cleavinger struck out Riley Greene to end the inning.
Zack Littell (8-7) allowed three runs in 5 2/3 innings for the Rays.
----
How can I watch Tampa Bay Rays vs. Detroit Tigers?
- TV Channel: Rays at Tigers 2022 MLB Baseball, is broadcasted on MLB.TV.
- Online streaming: Sign up for Fubo.
Scoring Summary
 |
9th Inning | Torres grounded out to second. |
 |
9th Inning | Keith singled to right. |
 |
9th Inning | Sweeney lined out to left. |
 |
9th Inning | Sweeney hit for Rogers |
 |
9th Inning | Meadows struck out looking. |
 |
9th Inning | Fairbanks relieved Englert |
Statistics
 TB TB |
 DET DET |
|
|---|---|---|
| 1 | Games Played | 1 |
| 1 | Team Games Played | 1 |
| 0 | Hit By Pitch | 0 |
| 14 | Ground Balls | 9 |
| 4 | Strikeouts | 7 |
| 7 | Runs Batted In | 3 |
| 0 | Sacrifice Hit | 0 |
| 16 | Hits | 8 |
| 3 | Stolen Bases | 0 |
| 2 | Walks | 4 |
| 0 | Catcher Interference | 0 |
| 7 | Runs | 3 |
| 2 | Ground Into Double Play | 0 |
| 0 | Sacrifice Flies | 0 |
| 40 | At Bats | 34 |
| 1 | Home Runs | 0 |
| 0 | Grand Slam Home Runs | 0 |
| 21 | Runners Left On Base | 14 |
| 0 | Triples | 0 |
| 1 | Game Winning RBIs | 0 |
| 0 | Intentional Walks | 0 |
| 4 | Doubles | 3 |
| 22 | Fly Balls | 18 |
| 1 | Caught Stealing | 0 |
| 163 | Pitches | 136 |
| 0 | Games Started | 0 |
| 0 | Pinch At Bats | 1 |
| 0 | Pinch Hits | 0 |
| 0.0 | Player Rating | 0.0 |
| 1 | Is Qualified | 1 |
| 1 | Is Qualified In Steals | 0 |
| 23 | Total Bases | 11 |
| 42 | Plate Appearances | 38 |
| 162.0 | Projected Home Runs | 0.0 |
| 5 | Extra Base Hits | 3 |
| 8.6 | Runs Created | 3.8 |
| .400 | Batting Average | .235 |
| .000 | Pinch Hit Average | .000 |
| .575 | Slugging Percentage | .324 |
| .275 | Secondary Average | .206 |
| .429 | On Base Percentage | .316 |
| 1.004 | OBP Pct + SLG Pct | .639 |
| 0.6 | Ground To Fly Ball Ratio | 0.5 |
| 8.6 | Runs Created Per 27 Outs | 3.9 |
| 58.0 | Batter Rating | 26.0 |
| 40.0 | At Bats Per Home Run | 0.0 |
| 0.75 | Stolen Base Percentage | 0.00 |
| 3.88 | Pitches Per Plate Appearance | 3.58 |
| .175 | Isolated Power | .088 |
| 0.50 | Walk To Strikeout Ratio | 0.57 |
| .048 | Walks Per Plate Appearance | .105 |
| -.125 | Secondary Average Minus Batting Average | -.029 |
| 14.0 | Runs Produced | 6.0 |
| 1.0 | Runs Ratio | 1.0 |
| 0.6 | Patience Ratio | 0.4 |
| 0.4 | Balls In Play Average | 0.3 |
| 106.0 | MLB Rating | 76.8 |
| 0.0 | Offensive Wins Above Replacement | 0.0 |
| 0.0 | Wins Above Replacement | 0.0 |
Game Information

Location: Detroit, Michigan
Attendance: 22,019 | Capacity:
2025 American League East Standings
| TEAM | W | L | PCT | GB | STRK |
|---|---|---|---|---|---|
 Toronto Toronto |
55 | 41 | .573 | - | L2 |
 New York New York |
53 | 43 | .552 | 2 | L2 |
 Boston Boston |
53 | 45 | .541 | 3 | W10 |
 Tampa Bay Tampa Bay |
50 | 47 | .515 | 5.5 | L4 |
 Baltimore Baltimore |
43 | 52 | .453 | 11.5 | L2 |
2025 American League Central Standings
| TEAM | W | L | PCT | GB | STRK |
|---|---|---|---|---|---|
 Detroit Detroit |
59 | 38 | .608 | - | L4 |
 Minnesota Minnesota |
47 | 49 | .490 | 11.5 | L1 |
 Kansas City Kansas City |
47 | 50 | .485 | 12 | W1 |
 Cleveland Cleveland |
46 | 49 | .484 | 12 | W2 |
 Chicago Chicago |
32 | 65 | .330 | 27 | L2 |