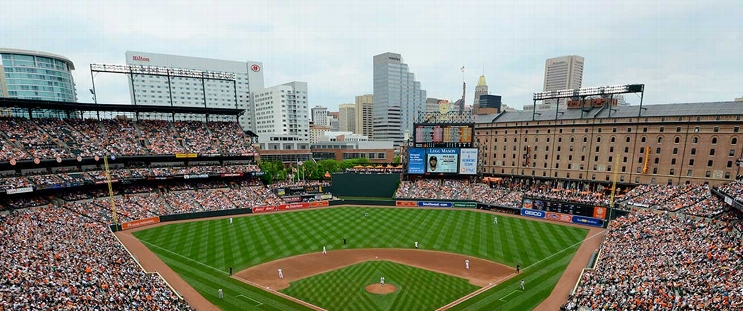
New York Mets at Baltimore Orioles
· Doubleheader - Game 1
1 - 3

Gunnar Henderson homers as the Orioles beat the Mets 3-1 in doubleheader opener

Colton Cowser sparked Baltimore's winning rally with a leadoff single, chasing David Peterson. Henderson connected for his 11th homer against Ryne Stanek (2-5), a 400-foot drive to right on a 2-1 slider.
Ramon Laureano completed the Orioles' three-run eighth with a sacrifice fly. Grant Wolfram (1-0) worked two scoreless innings for his first career win, and Felix Bautista pitched a perfect ninth for his 18th save.
It was a morale-boosting result for the Orioles after the day began with the trade of high-leverage reliever Bryan Baker to Tampa Bay.
Tyrone Taylor hit an RBI double for New York in the fifth against Charlie Morton. Peterson allowed five hits, struck out six and walked none.
The Mets scored four times in the eighth in a 7-6, 10-inning victory in the series opener on Tuesday.
The split doubleheader was scheduled after Wednesday’s game was postponed due to forecasted inclement weather.
Mets designated hitter Jesse Winker departed in the fourth with back tightness.
How can I watch New York Mets vs. Baltimore Orioles?
- TV Channel: Mets at Orioles 2022 MLB Baseball, is broadcasted on MLBN.
- Online streaming: Sign up for Fubo.
Scoring Summary
 |
9th Inning | McNeil flied out to left. |
 |
9th Inning | McNeil hit for Taylor |
 |
9th Inning | Baty grounded out to shortstop. |
 |
9th Inning | Torrens lined out to shortstop. |
 |
9th Inning | Bautista relieved Wolfram |
 |
9th Inning | O'Hearn at first base. |
Statistics
 NYM NYM |
 BAL BAL |
|
|---|---|---|
| 1 | Games Played | 1 |
| 1 | Team Games Played | 1 |
| 0 | Hit By Pitch | 0 |
| 10 | Ground Balls | 10 |
| 8 | Strikeouts | 6 |
| 1 | Runs Batted In | 3 |
| 0 | Sacrifice Hit | 0 |
| 5 | Hits | 6 |
| 1 | Stolen Bases | 0 |
| 3 | Walks | 4 |
| 0 | Catcher Interference | 0 |
| 1 | Runs | 3 |
| 0 | Ground Into Double Play | 0 |
| 0 | Sacrifice Flies | 1 |
| 33 | At Bats | 27 |
| 0 | Home Runs | 1 |
| 0 | Grand Slam Home Runs | 0 |
| 17 | Runners Left On Base | 10 |
| 0 | Triples | 0 |
| 0 | Game Winning RBIs | 1 |
| 1 | Intentional Walks | 0 |
| 2 | Doubles | 0 |
| 15 | Fly Balls | 12 |
| 0 | Caught Stealing | 0 |
| 150 | Pitches | 124 |
| 0 | Games Started | 0 |
| 2 | Pinch At Bats | 1 |
| 0 | Pinch Hits | 1 |
| 0.0 | Player Rating | 0.0 |
| 1 | Is Qualified | 1 |
| 1 | Is Qualified In Steals | 0 |
| 7 | Total Bases | 9 |
| 36 | Plate Appearances | 32 |
| 0.0 | Projected Home Runs | 162.0 |
| 2 | Extra Base Hits | 1 |
| 1.4 | Runs Created | 3.3 |
| .152 | Batting Average | .222 |
| .000 | Pinch Hit Average | 1.000 |
| .212 | Slugging Percentage | .333 |
| .182 | Secondary Average | .259 |
| .222 | On Base Percentage | .313 |
| .434 | OBP Pct + SLG Pct | .646 |
| 0.7 | Ground To Fly Ball Ratio | 0.8 |
| 1.4 | Runs Created Per 27 Outs | 4.0 |
| 14.0 | Batter Rating | 21.0 |
| 0.0 | At Bats Per Home Run | 27.0 |
| 1.00 | Stolen Base Percentage | 0.00 |
| 4.17 | Pitches Per Plate Appearance | 3.88 |
| .061 | Isolated Power | .111 |
| 0.38 | Walk To Strikeout Ratio | 0.67 |
| .083 | Walks Per Plate Appearance | .125 |
| .030 | Secondary Average Minus Batting Average | .037 |
| 2.0 | Runs Produced | 6.0 |
| 1.0 | Runs Ratio | 1.0 |
| 0.3 | Patience Ratio | 0.4 |
| 0.2 | Balls In Play Average | 0.3 |
| 65.0 | MLB Rating | 74.5 |
| 0.0 | Offensive Wins Above Replacement | 0.0 |
| 0.0 | Wins Above Replacement | 0.0 |
Game Information

Location: Baltimore, Maryland
Attendance: 25,262 | Capacity:
2025 National League East Standings
| TEAM | W | L | PCT | GB | STRK |
|---|---|---|---|---|---|
 Philadelphia Philadelphia |
55 | 41 | .573 | - | W1 |
 New York New York |
55 | 42 | .567 | 0.5 | L1 |
 Miami Miami |
44 | 51 | .463 | 10.5 | W2 |
 Atlanta Atlanta |
42 | 53 | .442 | 12.5 | L1 |
 Washington Washington |
38 | 58 | .396 | 17 | L4 |
2025 American League East Standings
| TEAM | W | L | PCT | GB | STRK |
|---|---|---|---|---|---|
 Toronto Toronto |
55 | 41 | .573 | - | L2 |
 New York New York |
53 | 43 | .552 | 2 | L2 |
 Boston Boston |
53 | 45 | .541 | 3 | W10 |
 Tampa Bay Tampa Bay |
50 | 47 | .515 | 5.5 | L4 |
 Baltimore Baltimore |
43 | 52 | .453 | 11.5 | L2 |