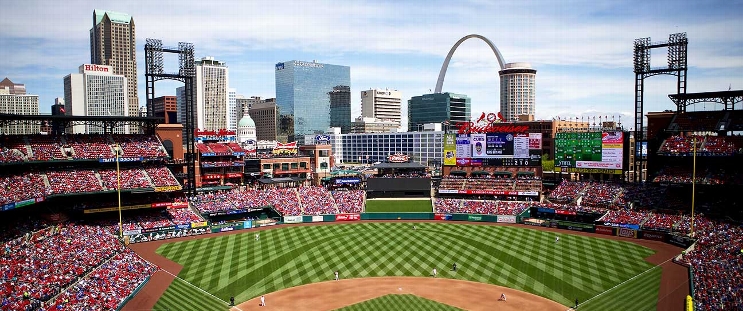
Washington Nationals at St. Louis Cardinals
· Major League Baseball
1 - 8

Miles Mikolas stars as the Cardinals beat the Nationals 8-1

Willson Contreras homered and Alec Burleson drove in two runs as St. Louis won the rubber game in the three-game series. Brendan Donovan had two hits, scored twice and drove in a run.
St. Louis (50-44) went 5-1 against Washington this year, winning the season series against the Nationals (38-55) for the first time since 2021.
Mikolas (5-6) struck out six and walked one in 5 2/3 innings. It was his first win since May 23.
Jacob Young drove in Washington's only run on a fielder's choice in the eighth.
Nationals right-hander Michael Soroka (3-7) worked four innings of two-run ball. He threw 91 pitches, 57 for strikes.
The Cardinals opened a 7-0 lead with five runs in the sixth. Nolan Arenado and Yohel Pozo each hit an RBI single, and Masyn Winn capped the big inning with a run-scoring double.
Contreras led off the seventh with his 12th homer, a 406-foot drive to center off Jackson Rutledge.
Cardinals LHP Matthew Liberatore (6-6, 3.70 ERA) starts Friday against the visiting Braves and RHP Grant Holmes (4-8, 3.44 ERA).
How can I watch Washington Nationals vs. St. Louis Cardinals?
- TV Channel: Nationals at Cardinals 2022 MLB Baseball, is broadcasted on MLB.TV.
- Online streaming: Sign up for Fubo.
Scoring Summary
 |
9th Inning | DeJong flied out to center. |
 |
9th Inning | Lowe singled to right, Bell to second. |
 |
9th Inning | Bell walked. |
 |
9th Inning | García Jr. lined out to left. |
 |
9th Inning | Wood struck out swinging. |
 |
8th Inning | Donovan grounded out to second. |
Statistics
 WSH WSH |
 STL STL |
|
|---|---|---|
| 1 | Games Played | 1 |
| 1 | Team Games Played | 1 |
| 0 | Hit By Pitch | 0 |
| 15 | Ground Balls | 12 |
| 7 | Strikeouts | 8 |
| 1 | Runs Batted In | 8 |
| 0 | Sacrifice Hit | 0 |
| 4 | Hits | 10 |
| 0 | Stolen Bases | 1 |
| 3 | Walks | 3 |
| 0 | Catcher Interference | 0 |
| 1 | Runs | 8 |
| 1 | Ground Into Double Play | 0 |
| 0 | Sacrifice Flies | 1 |
| 30 | At Bats | 33 |
| 0 | Home Runs | 1 |
| 0 | Grand Slam Home Runs | 0 |
| 10 | Runners Left On Base | 13 |
| 0 | Triples | 0 |
| 0 | Game Winning RBIs | 1 |
| 0 | Intentional Walks | 0 |
| 1 | Doubles | 3 |
| 8 | Fly Balls | 14 |
| 0 | Caught Stealing | 0 |
| 125 | Pitches | 161 |
| 0 | Games Started | 0 |
| 0 | Pinch At Bats | 1 |
| 0 | Pinch Hits | 0 |
| 0.0 | Player Rating | 0.0 |
| 1 | Is Qualified | 1 |
| 0 | Is Qualified In Steals | 1 |
| 5 | Total Bases | 16 |
| 33 | Plate Appearances | 37 |
| 0.0 | Projected Home Runs | 162.0 |
| 1 | Extra Base Hits | 4 |
| 0.3 | Runs Created | 6.0 |
| .133 | Batting Average | .303 |
| .000 | Pinch Hit Average | .000 |
| .167 | Slugging Percentage | .485 |
| .133 | Secondary Average | .303 |
| .212 | On Base Percentage | .351 |
| .379 | OBP Pct + SLG Pct | .836 |
| 1.9 | Ground To Fly Ball Ratio | 0.9 |
| 0.3 | Runs Created Per 27 Outs | 6.8 |
| 10.0 | Batter Rating | 52.0 |
| 0.0 | At Bats Per Home Run | 33.0 |
| 0.00 | Stolen Base Percentage | 1.00 |
| 3.79 | Pitches Per Plate Appearance | 4.35 |
| .033 | Isolated Power | .182 |
| 0.43 | Walk To Strikeout Ratio | 0.38 |
| .091 | Walks Per Plate Appearance | .081 |
| .000 | Secondary Average Minus Batting Average | .000 |
| 2.0 | Runs Produced | 16.0 |
| 1.0 | Runs Ratio | 1.0 |
| 0.2 | Patience Ratio | 0.5 |
| 0.2 | Balls In Play Average | 0.4 |
| 62.5 | MLB Rating | 94.5 |
| 0.0 | Offensive Wins Above Replacement | 0.0 |
| 0.0 | Wins Above Replacement | 0.0 |
Game Information

Location: St. Louis, Missouri
Attendance: 21,141 | Capacity:
2025 National League East Standings
| TEAM | W | L | PCT | GB | STRK |
|---|---|---|---|---|---|
 Philadelphia Philadelphia |
55 | 41 | .573 | - | W1 |
 New York New York |
55 | 42 | .567 | 0.5 | L1 |
 Miami Miami |
44 | 51 | .463 | 10.5 | W2 |
 Atlanta Atlanta |
42 | 53 | .442 | 12.5 | L1 |
 Washington Washington |
38 | 58 | .396 | 17 | L4 |
2025 National League Central Standings
| TEAM | W | L | PCT | GB | STRK |
|---|---|---|---|---|---|
 Chicago Chicago |
57 | 39 | .594 | - | W2 |
 Milwaukee Milwaukee |
56 | 40 | .583 | 1 | W7 |
 St. Louis St. Louis |
51 | 46 | .526 | 6.5 | W1 |
 Cincinnati Cincinnati |
50 | 47 | .515 | 7.5 | W2 |
 Pittsburgh Pittsburgh |
39 | 58 | .402 | 18.5 | W1 |