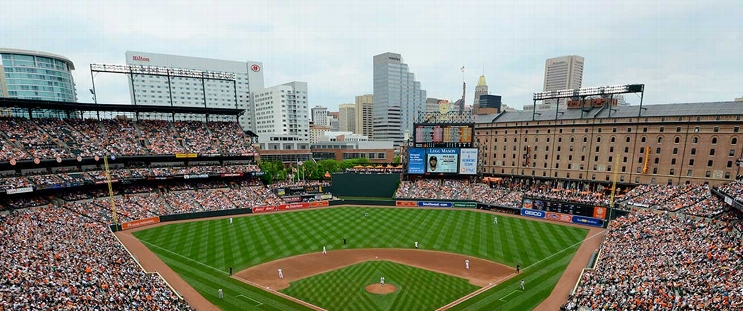
Miami Marlins at Baltimore Orioles
· Major League Baseball
2 - 5

Dean Kremer pitches 7 shutout inning to lead Orioles past Marlins 5-2

Kremer (8-7) struck out seven, walked one and kept Miami scoreless while allowing only one runner past first base. The right-hander finished his 99-pitch effort with two straight strikeouts.
Otto Lopez's two-run homer in the ninth enabled the Marlins to avoid their second consecutive shutout.
Back in Baltimore for the first time since being traded with Connor Norby to Miami last July 30, Kyle Stowers went 1 for 3 with a walk. Stowers received a smattering of applause from those in the crowd of 22,213 who recalled the 2019 second-round pick playing parts of three seasons with the Orioles.
Norby went 1 for 3.
Baltimore wasted no time grabbing the lead against Miami starter Edward Cabrera (3-4). Westburg singled in a run and scored on a double by O'Hearn in the first inning. In the third, the Orioles bunched together four straight hits, including an RBI single by O'Hearn and a run-scoring double by Laureano.
Laureano singled in a run in the seventh to make it 5-0.
How can I watch Miami Marlins vs. Baltimore Orioles?
- TV Channel: Marlins at Orioles 2022 MLB Baseball, is broadcasted on MLB.TV.
- Online streaming: Sign up for Fubo.
Scoring Summary
 |
9th Inning | Wagaman grounded out to shortstop. |
 |
9th Inning | Stowers struck out swinging. |
 |
9th Inning | Ramírez flied out to left. |
 |
9th Inning | Lopez homered to left center (386 feet), J. Sánchez scored. |
 |
9th Inning | J. Sánchez reached on infield single to shortstop. |
 |
9th Inning | Kittredge relieved Cano |
Statistics
 MIA MIA |
 BAL BAL |
|
|---|---|---|
| 1 | Games Played | 1 |
| 1 | Team Games Played | 1 |
| 0 | Hit By Pitch | 0 |
| 11 | Ground Balls | 10 |
| 9 | Strikeouts | 8 |
| 2 | Runs Batted In | 5 |
| 0 | Sacrifice Hit | 0 |
| 5 | Hits | 12 |
| 0 | Stolen Bases | 1 |
| 1 | Walks | 2 |
| 0 | Catcher Interference | 0 |
| 2 | Runs | 5 |
| 0 | Ground Into Double Play | 1 |
| 0 | Sacrifice Flies | 0 |
| 32 | At Bats | 35 |
| 1 | Home Runs | 0 |
| 0 | Grand Slam Home Runs | 0 |
| 7 | Runners Left On Base | 19 |
| 0 | Triples | 0 |
| 0 | Game Winning RBIs | 1 |
| 0 | Intentional Walks | 0 |
| 0 | Doubles | 3 |
| 12 | Fly Balls | 17 |
| 0 | Caught Stealing | 0 |
| 130 | Pitches | 138 |
| 0 | Games Started | 0 |
| 0 | Pinch At Bats | 0 |
| 0 | Pinch Hits | 0 |
| 0.0 | Player Rating | 0.0 |
| 1 | Is Qualified | 1 |
| 0 | Is Qualified In Steals | 1 |
| 8 | Total Bases | 15 |
| 33 | Plate Appearances | 37 |
| 162.0 | Projected Home Runs | 0.0 |
| 1 | Extra Base Hits | 3 |
| 1.0 | Runs Created | 5.5 |
| .156 | Batting Average | .343 |
| .000 | Pinch Hit Average | .000 |
| .250 | Slugging Percentage | .429 |
| .125 | Secondary Average | .171 |
| .182 | On Base Percentage | .378 |
| .432 | OBP Pct + SLG Pct | .807 |
| 0.9 | Ground To Fly Ball Ratio | 0.6 |
| 1.0 | Runs Created Per 27 Outs | 6.2 |
| 16.0 | Batter Rating | 39.0 |
| 32.0 | At Bats Per Home Run | 0.0 |
| 0.00 | Stolen Base Percentage | 1.00 |
| 3.94 | Pitches Per Plate Appearance | 3.73 |
| .094 | Isolated Power | .086 |
| 0.11 | Walk To Strikeout Ratio | 0.25 |
| .030 | Walks Per Plate Appearance | .054 |
| -.031 | Secondary Average Minus Batting Average | -.171 |
| 4.0 | Runs Produced | 10.0 |
| 1.0 | Runs Ratio | 1.0 |
| 0.3 | Patience Ratio | 0.5 |
| 0.2 | Balls In Play Average | 0.4 |
| 67.3 | MLB Rating | 89.0 |
| 0.0 | Offensive Wins Above Replacement | 0.0 |
| 0.0 | Wins Above Replacement | 0.0 |
Game Information

Location: Baltimore, Maryland
Attendance: 22,213 | Capacity:
2025 National League East Standings
| TEAM | W | L | PCT | GB | STRK |
|---|---|---|---|---|---|
 Philadelphia Philadelphia |
55 | 41 | .573 | - | W1 |
 New York New York |
55 | 42 | .567 | 0.5 | L1 |
 Miami Miami |
44 | 51 | .463 | 10.5 | W2 |
 Atlanta Atlanta |
42 | 53 | .442 | 12.5 | L1 |
 Washington Washington |
38 | 58 | .396 | 17 | L4 |
2025 American League East Standings
| TEAM | W | L | PCT | GB | STRK |
|---|---|---|---|---|---|
 Toronto Toronto |
55 | 41 | .573 | - | L2 |
 New York New York |
53 | 43 | .552 | 2 | L2 |
 Boston Boston |
53 | 45 | .541 | 3 | W10 |
 Tampa Bay Tampa Bay |
50 | 47 | .515 | 5.5 | L4 |
 Baltimore Baltimore |
43 | 52 | .453 | 11.5 | L2 |